Questions

Questions answered in this article:
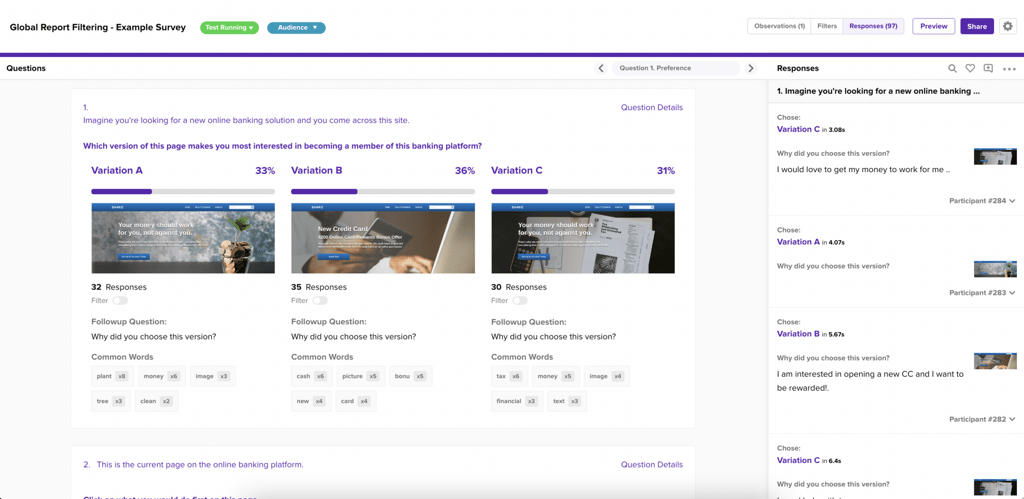
When you first enter your data report, you’ll be looking at your report in what we call the Summary view. In this view, you can freely scroll through the questions in your survey on the left and you’ll see any written answers from participants in the Response panel to your right.

You can quickly jump-to any question in the survey using the dropdown menu in the top-right of the questions column, and arrow through questions individually.

To evaluate individual questions on the survey, click on Question Details in the top right corner of any question card in the column. This will place you into a view focused on the responses to that specific question.
The first and most simple way to evaluate the data for each question is by hovering over each bar in a graph to get an exact read of your percentages.

Click on a data bar to filter the report so you only see responses from participants who selected that answer. You can select as many data bars as you want to activate multiple filters, and to see the total percentage of a collection of answers.

Different question types provide you the ability to do similar filtering in unique ways. For instance, to filter by participants who interacted with a certain feature on a click test, you can drag and outline a collection of clicks to see only responses from those participants.

A preference test allows you to click into one of the variations to filter responses by those selected clicked A or B (or C).

If you’ve asked a qualitative follow-up to your quant question, you also have the option to filter by Common Words. Helio’s system picks up on the most frequently used terms in the qualitative responses and provides the top 5 as filters for you to examine that info in the Responses panel.

When you click on a Common Words filter, you’ll see those specific responses highlighted in the Responses panel to your right.

Check out more about how to use our filtering features in the following Global Report Filtering article.
