
We crunch the numbers so you can iterate
Helio makes analyzing test results a breeze! Get the metrics that matter, saving you time and making it simple to share your findings.

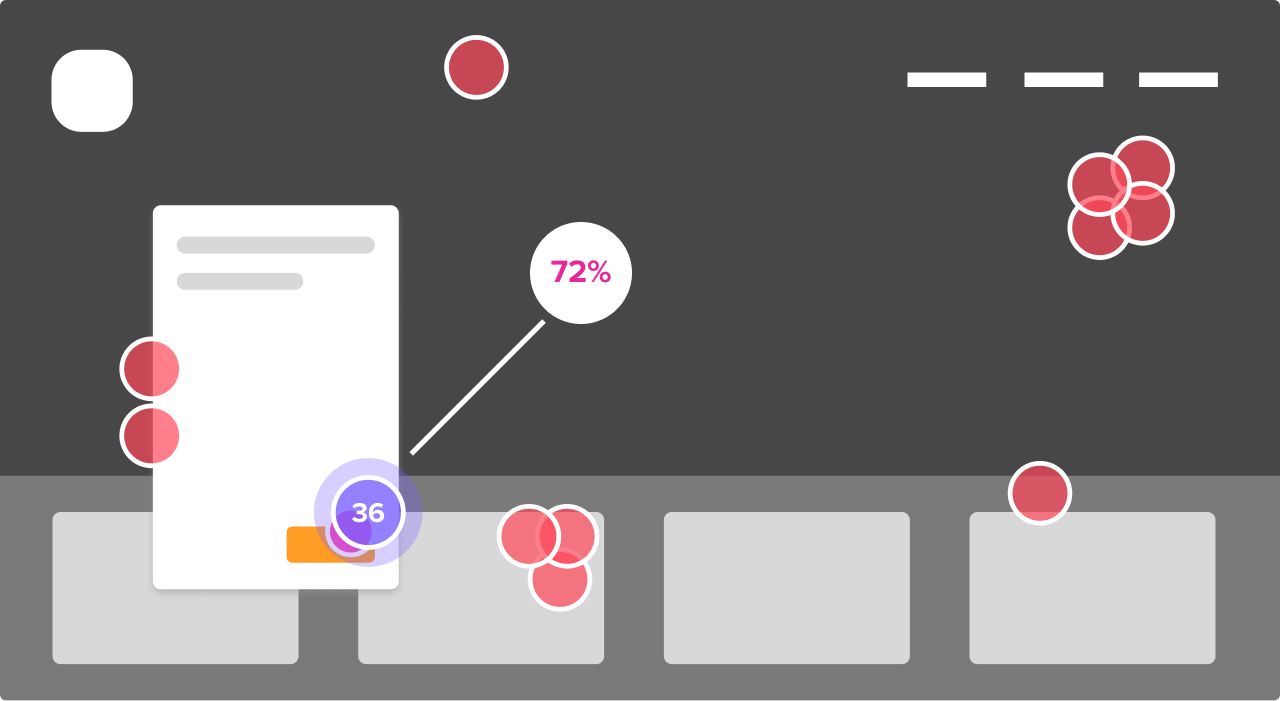
Discover the power of automated metrics
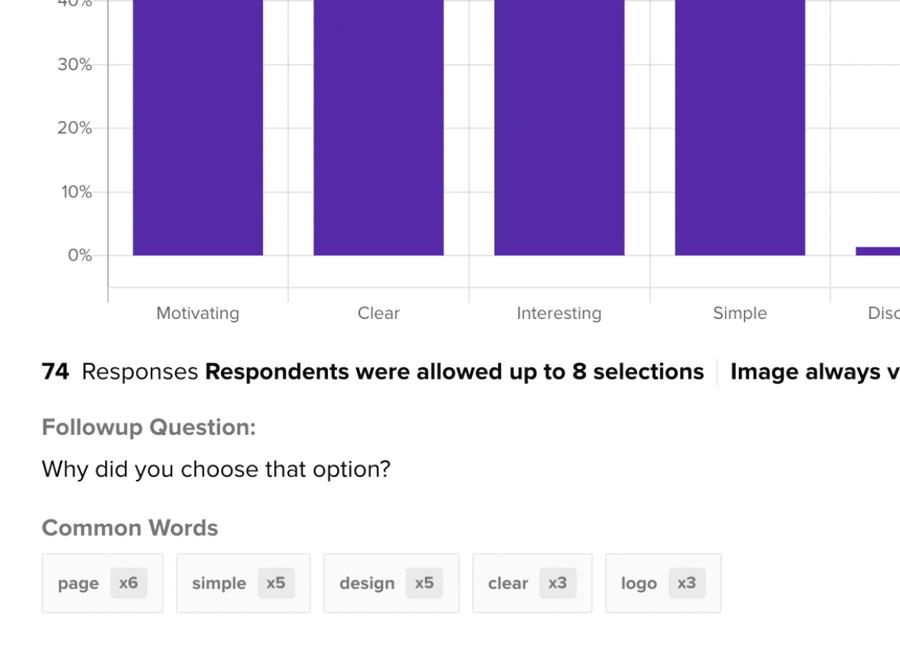
Helio turns data into valuable insights in real time. From bounce rates to clickmaps, our visual-rich reports give your team the information they need to make quick decisions as you collect participant data.
Filter your view for segmented results
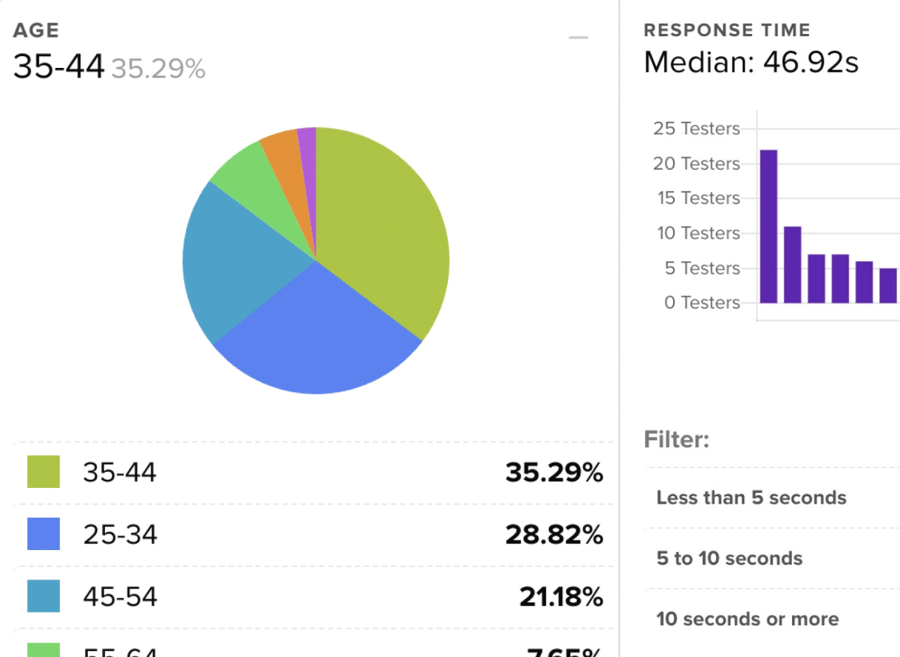
Customize your insights with powerful filters to uncover valuable information. Filter your report data by question responses, demographics, response time, or sentiment.
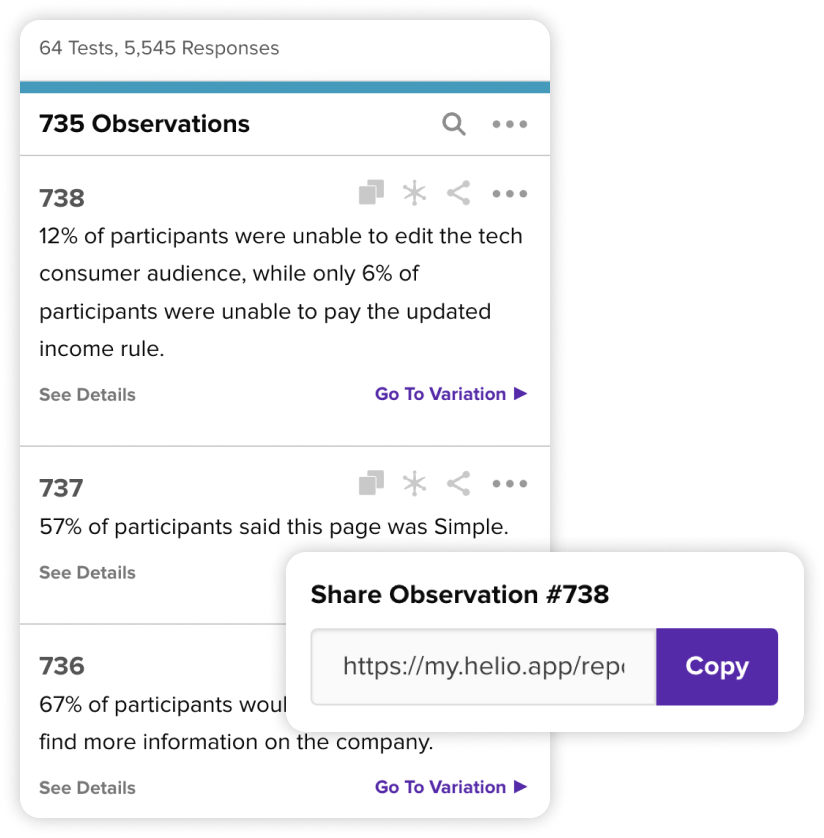
Research autonomously and share reports
Our unique, automated reports simplify sharing key observations with your team. Add observations, deep link data sources, and easily share reports with stakeholders.
Survey reports that drive team decision-making

Quickly make sense of the data

Report filtering anyone can use

Supercharge team collaboration
Test your design concepts
Get immediate answers from real users. Create and share usability tests, and collect valuable insights throughout your product’s life cycle.
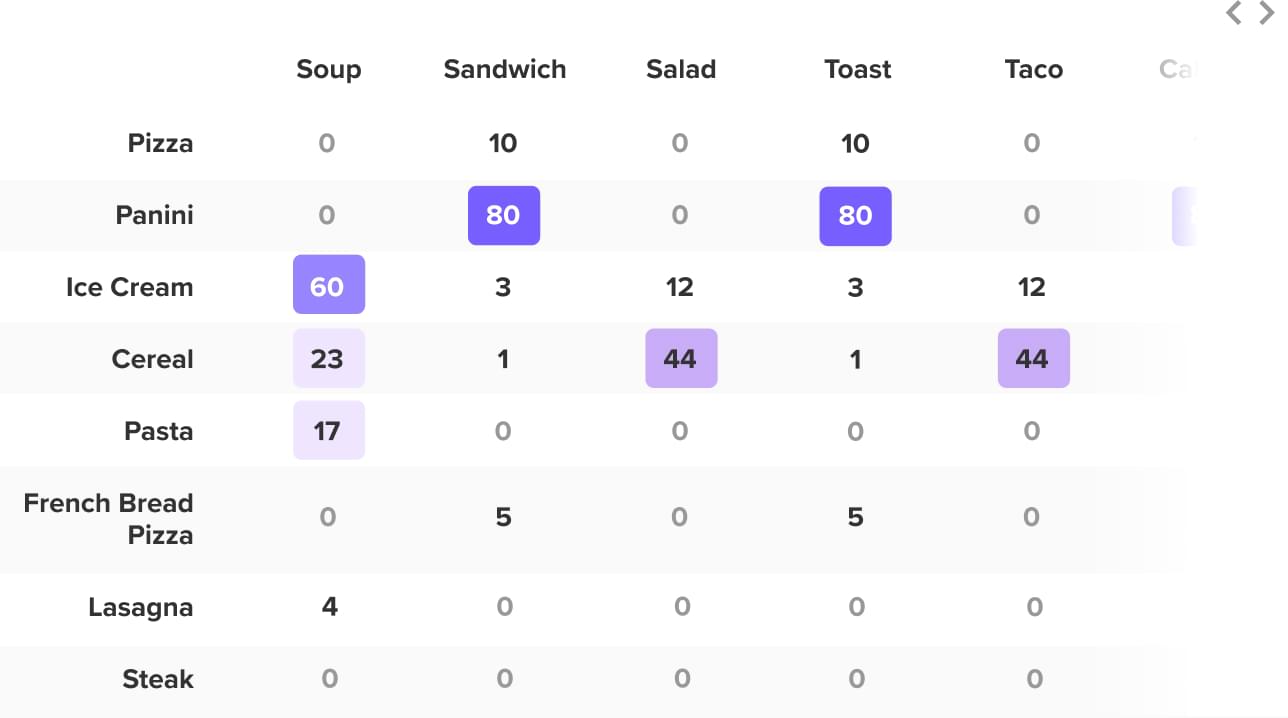
Rank
Use Ranking in your creative process to understand how your audience prioritizes options in different situations, from feature concepts to orders of operation.
Live Example
Ideal rank
Get a quick and easy read on the ideal list order your audience places ideas into.
Customer flows & journeys
Map out your customer’s user journeys based on the preferred order of operation for an audience.
Prioritizing your options
Find a few key ideas that your customers can’t live without. Perfect for your MVP!
MaxDiff
Understand the extremes of how your audience feels about your creative work. MaxDiff gives you a look at the best and worst parts of a group of ideas across an audience.
Live Example
Gauge extremes
Discover which concepts or features fall on the ends of a spectrum for your audience.
Find important trade-offs
Gauge which options on your list are falling out of favor with your audience.
Prioritize your options
Find a few key ideas that your customers can’t live without. Perfect for your MVP!
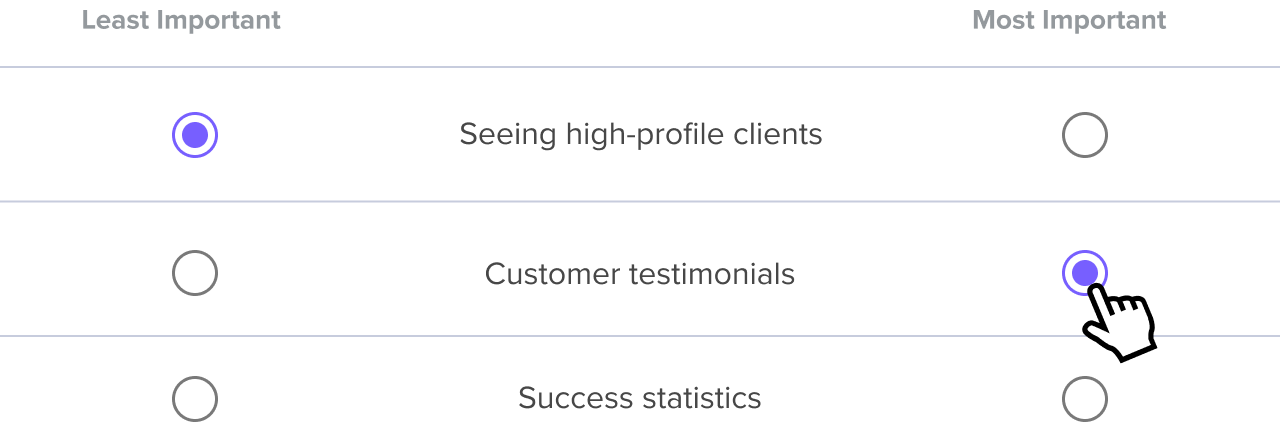
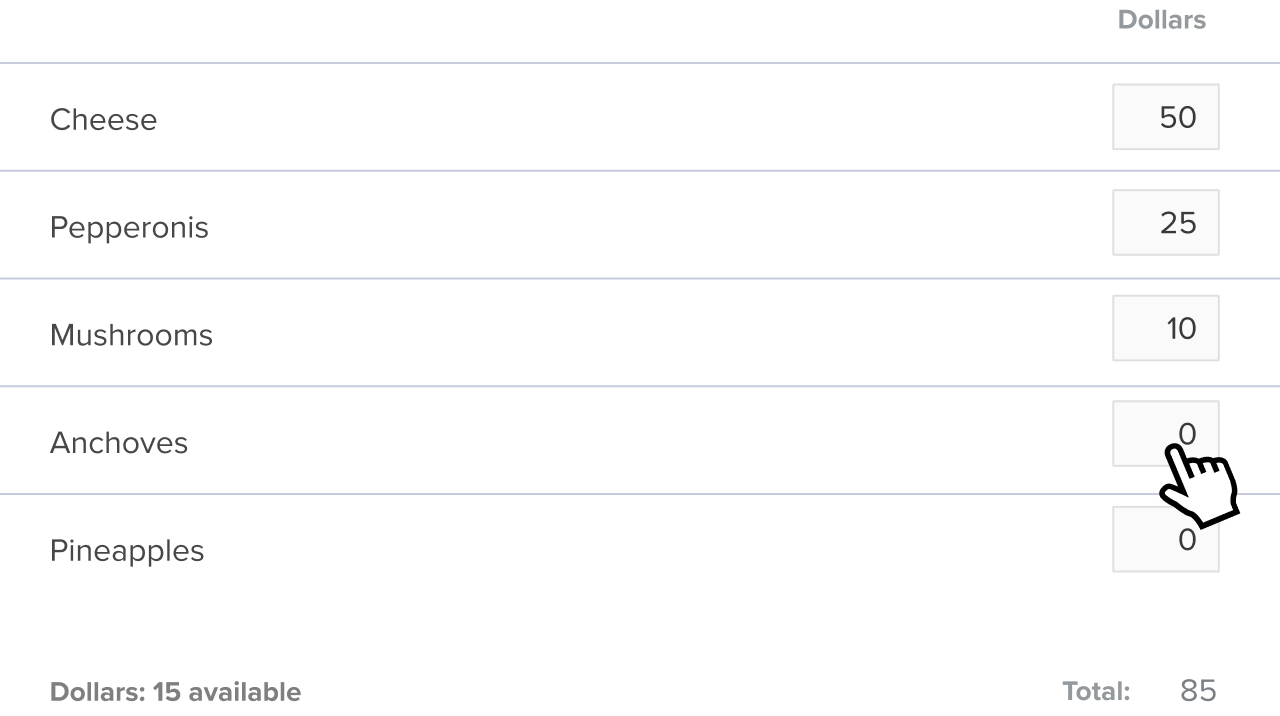
Point Allocation
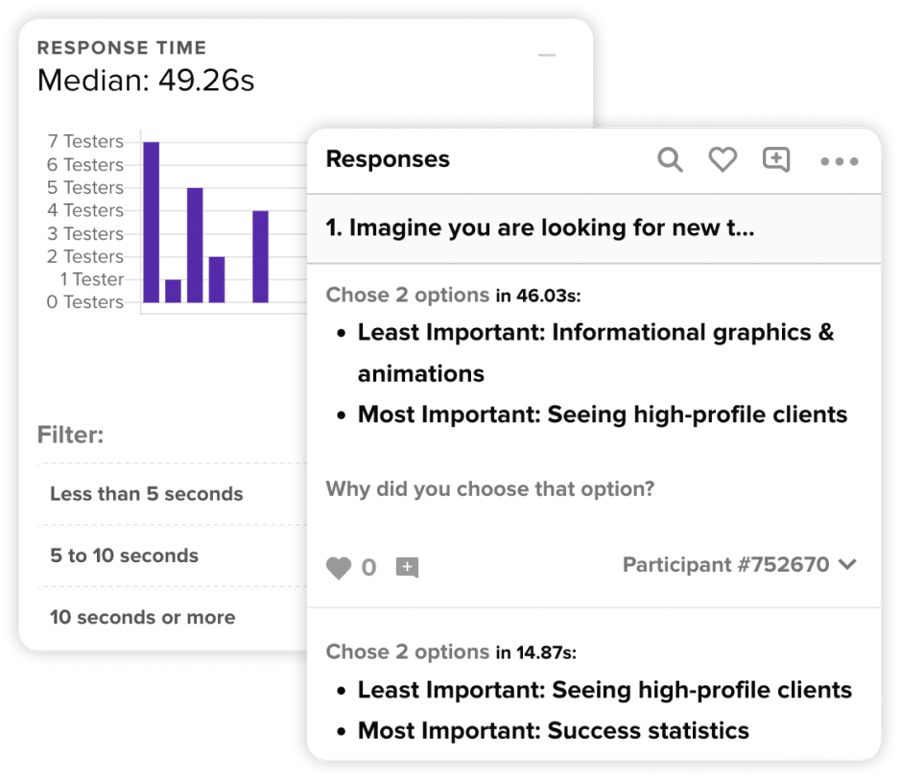
Use Point Allocation in your creative process to discover the relative importance of options in your list, so you know just how strongly your audience feels about one idea over another.
Live Example
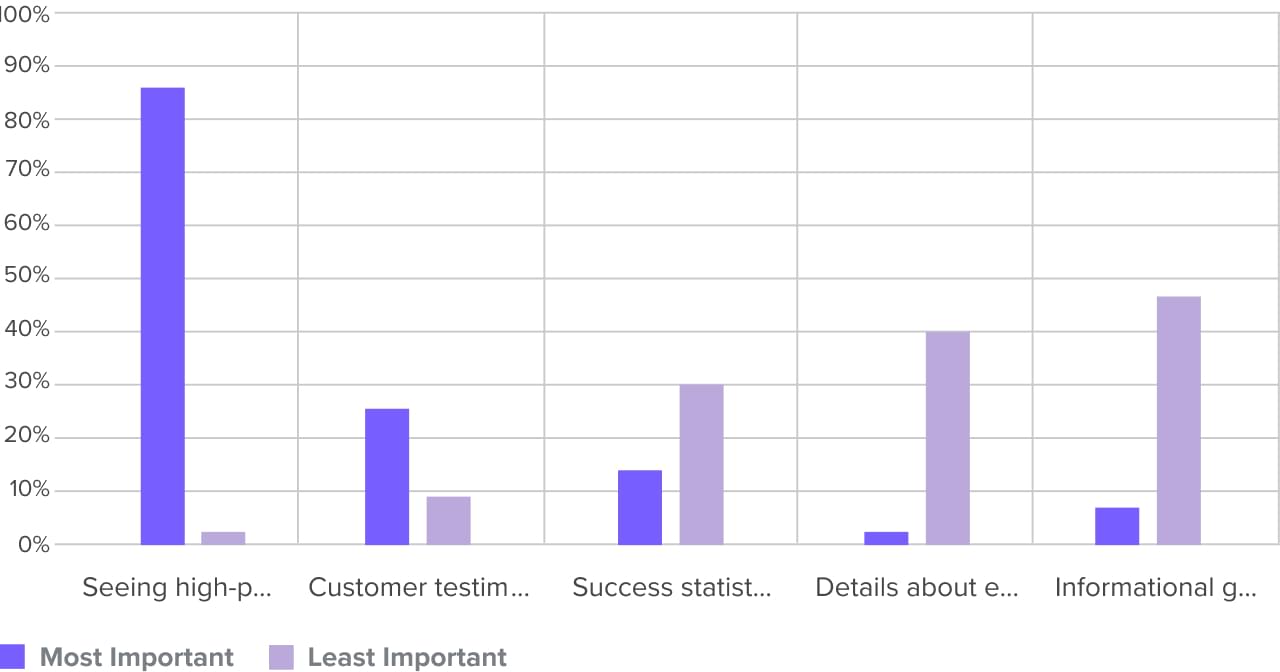
Discover priorities
See the ideal order of a list of items based on an audience’s prioritization.
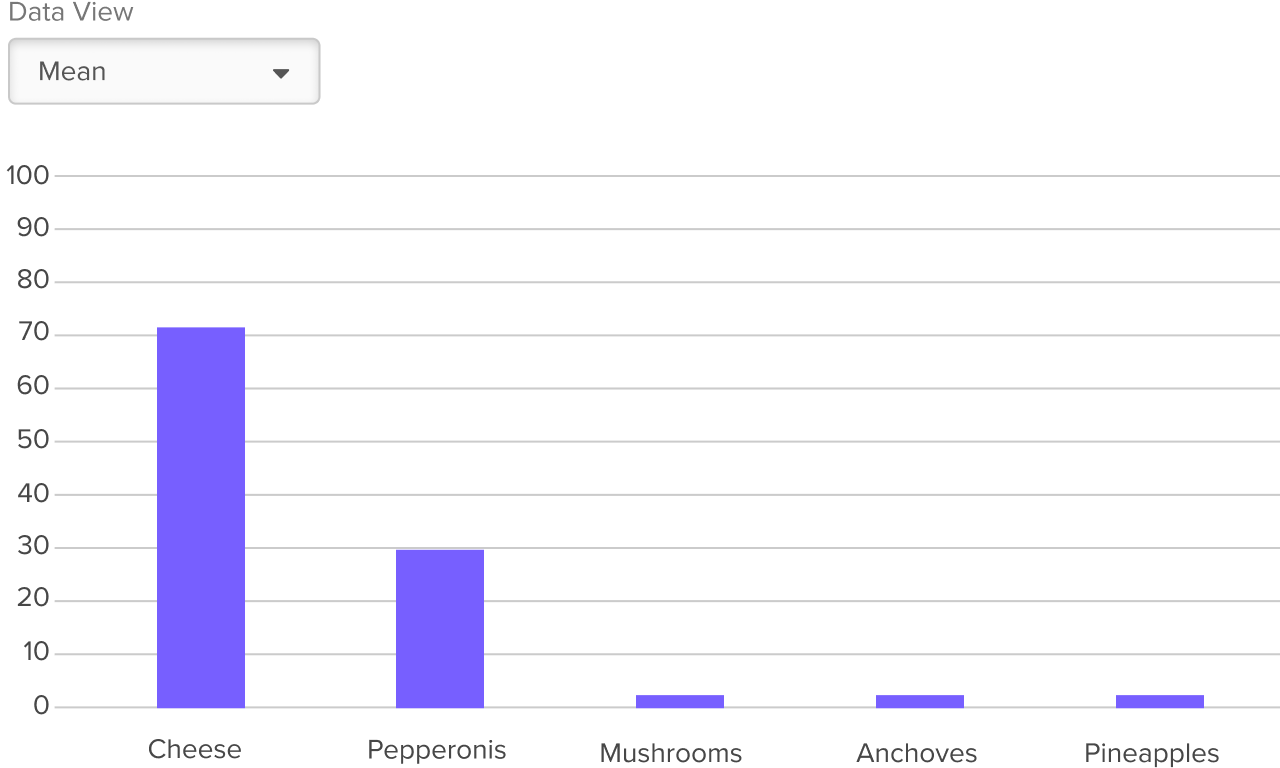
Uncover signal strength
Uncover how options are prioritized over each other and see the relative difference between 1st, 2nd, and 3rd ranked items.
Learn participants’ feelings
Assigning points allows you to see the complex feelings your participants have towards the items on your list.
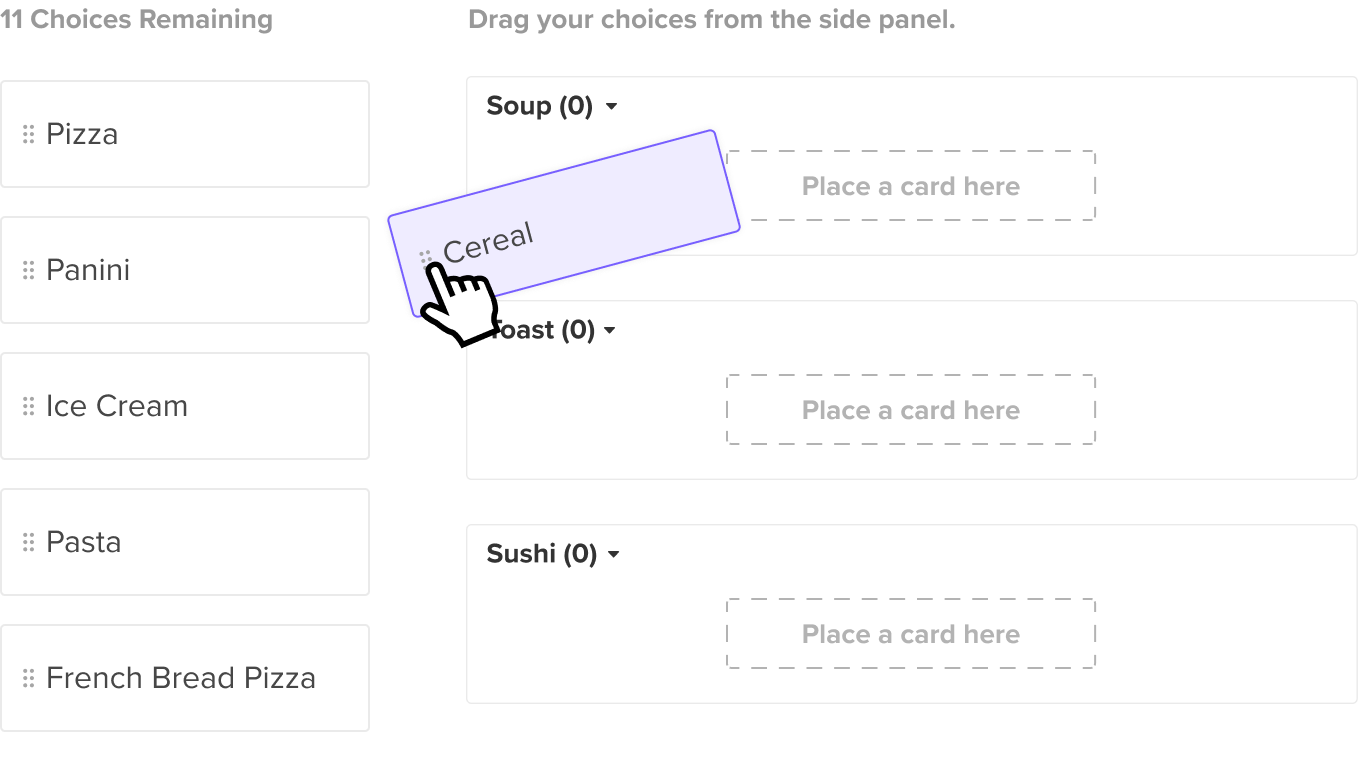
Card Sort
Use Cart Sort in your creative process to understand how an audience groups concepts. Figure out the mental models of your customers.
Build information architecture
Plan out a mega-menu or complex navigation based on where participants group information.
Understand groups of ideas
See how an audience reacts to your product experience by having them group ideas.
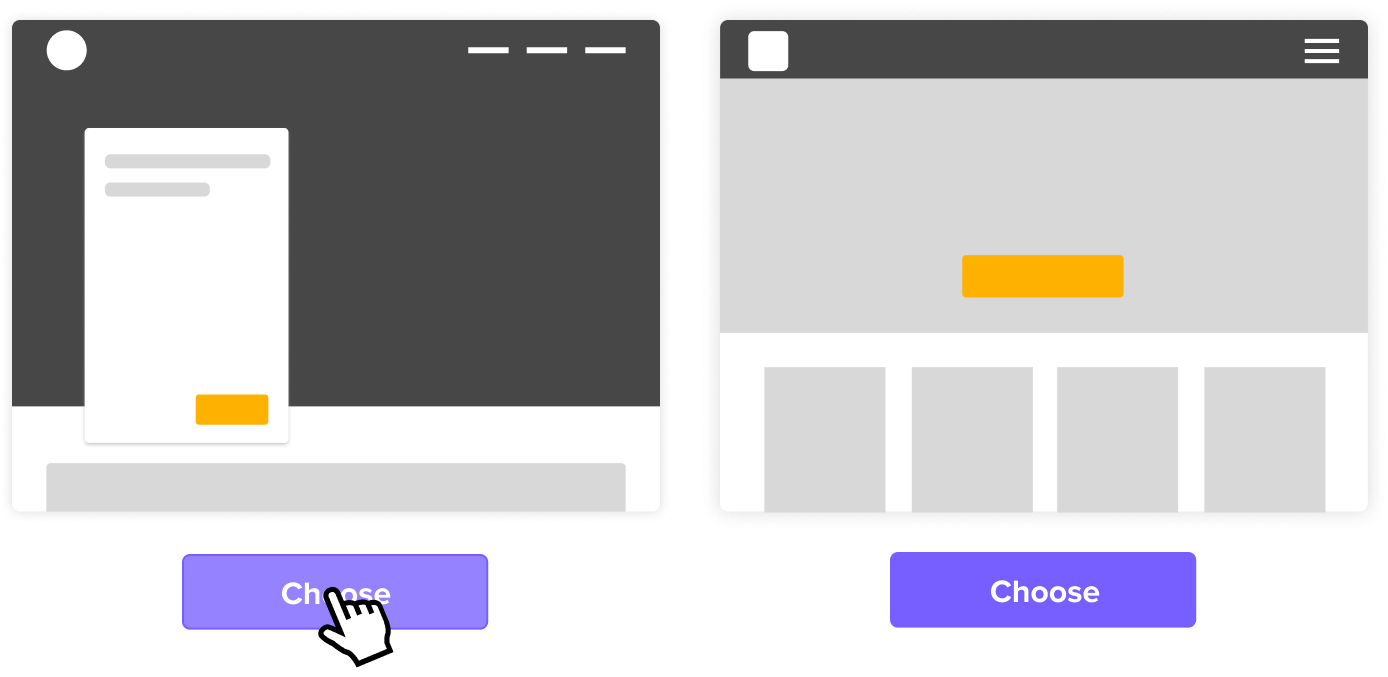
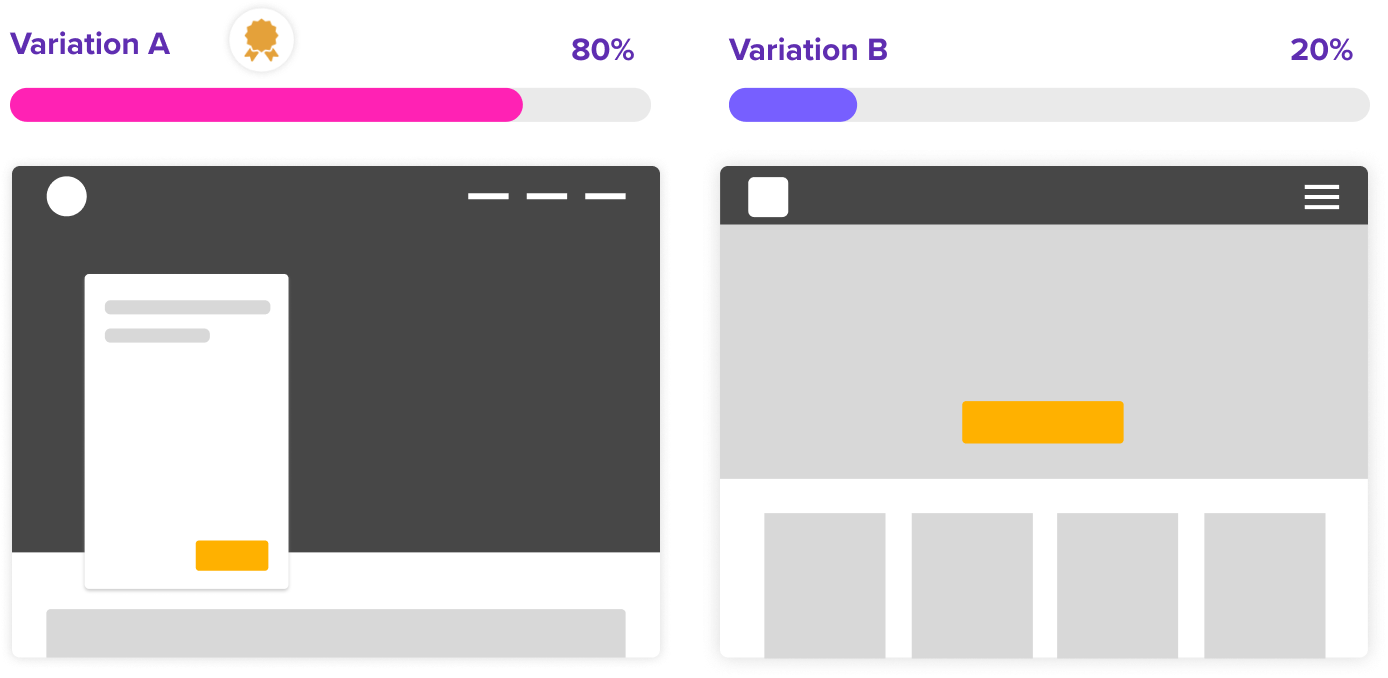
Preference Test
Collect gut reactions from participants on core visual elements or products. This is great for settling whether one direction is more effective than another.
Live Example
Quick conclusions
Get answers and draw actionable conclusions from two or more variations in minutes.
Focused reactions
Get focused reactions specific to a single variable or element.
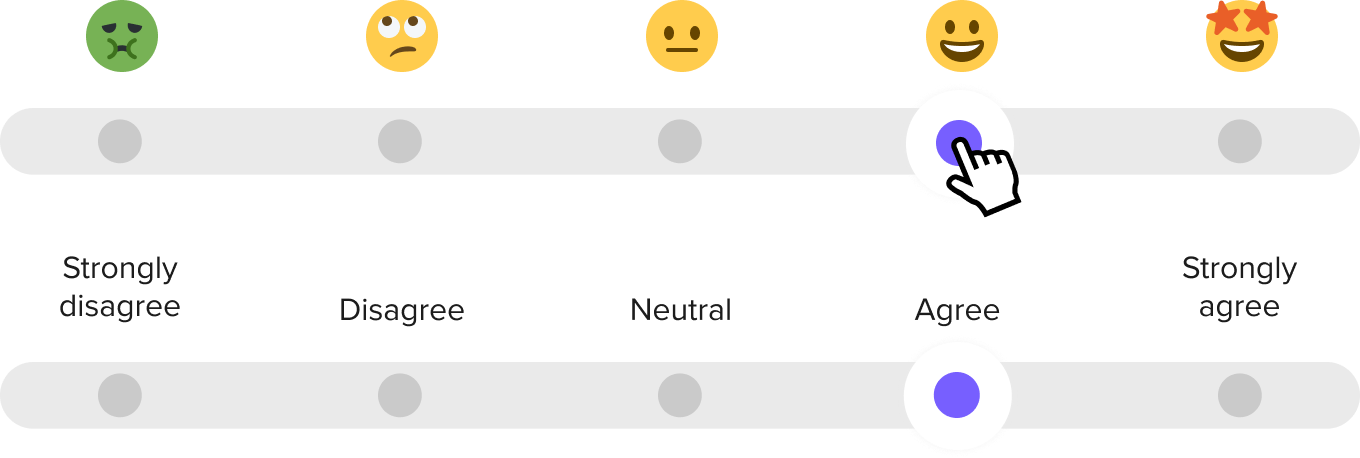
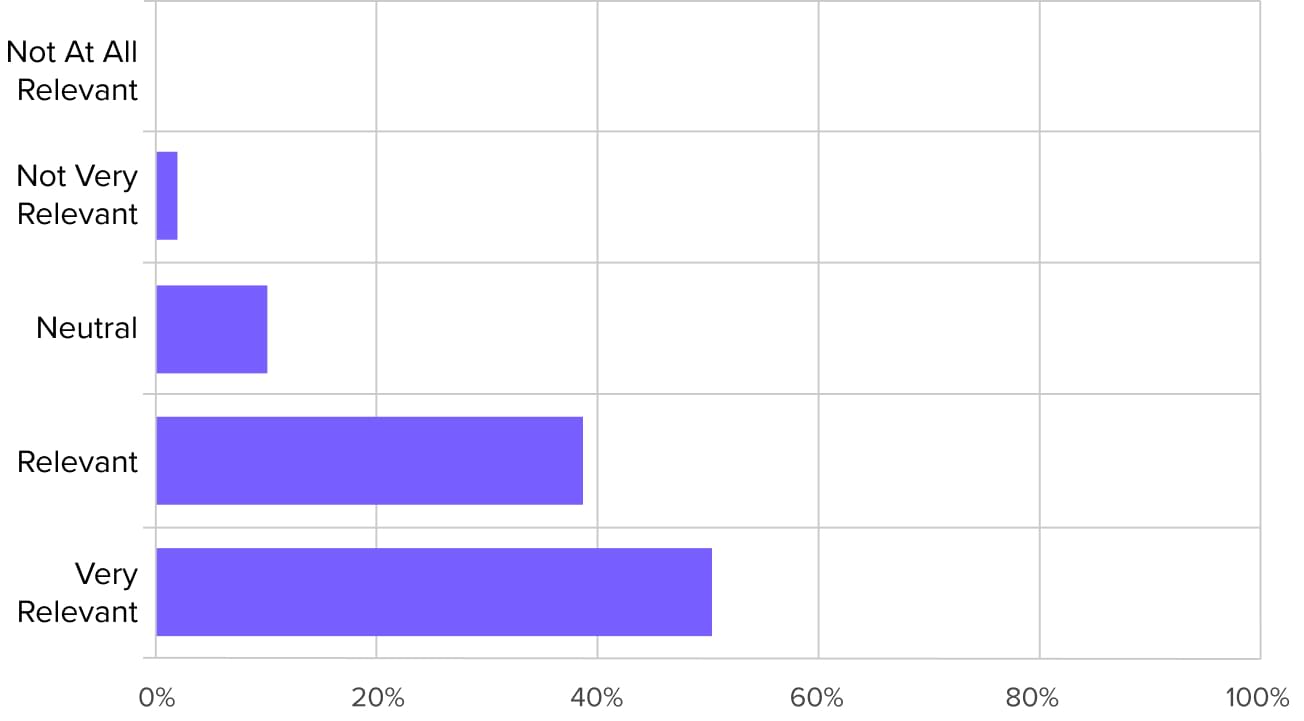
Likert
Measure participants’ reactions on a scale of your choosing. Ask your audience to gauge the importance of ideas, like new features to introduce into your business.
Live Example
Get fast results
Likerts are an easy question type to set up and even easier to take. Get answers and draw actionable conclusions in minutes.
Understanding your audience
Get information about how your audience thinks, what they prefer, and what their perceptions are about your company.
Evaluate an experience
Test specific moments within any user journey and get participants to share how they felt about an experience.
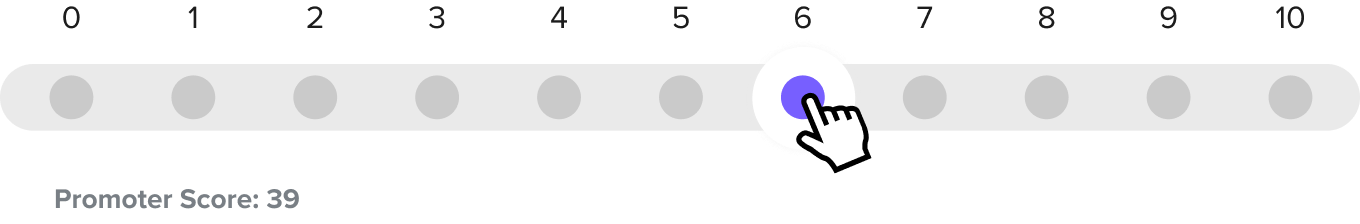
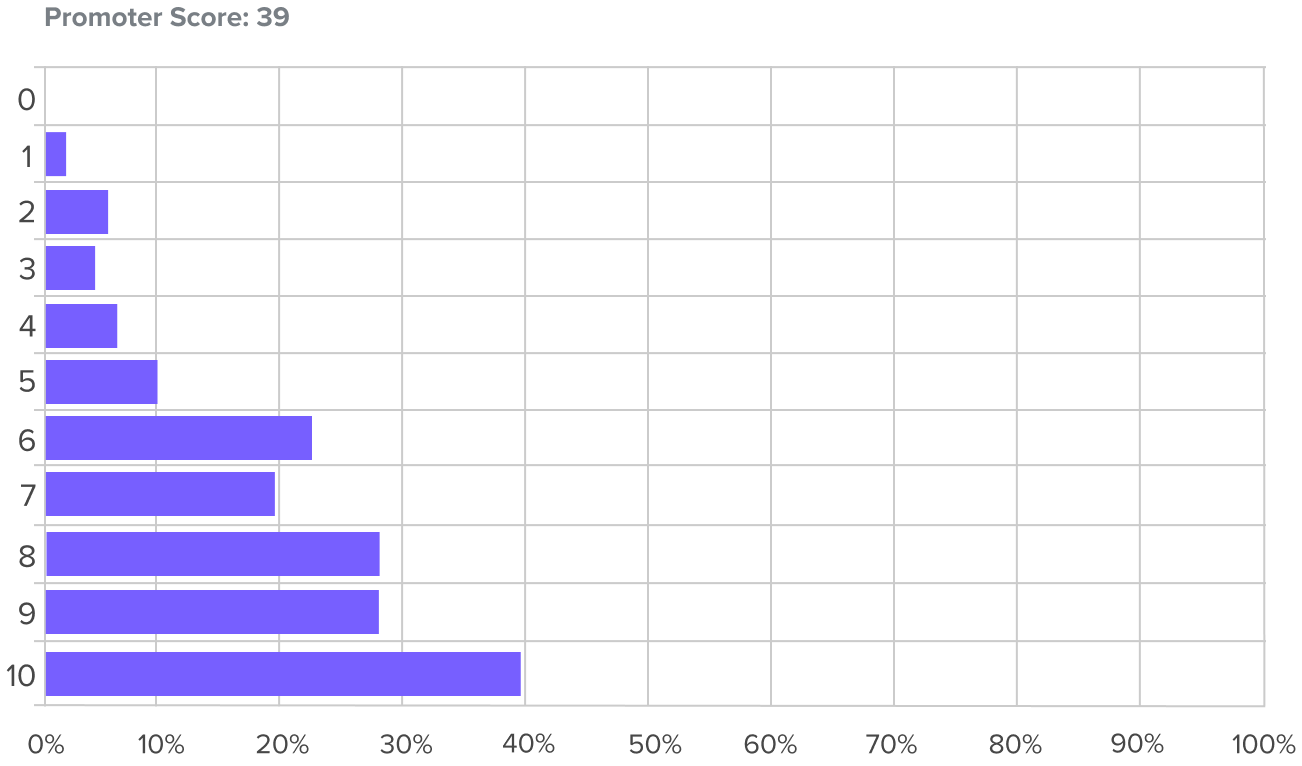
Numerical Scale
Get powerful quantitative feedback by asking participants to rate the likelihood or importance of actions on a simple 10 point scale.
Live Example
Quick conclusions
Get answers and draw actionable conclusions in minutes.
Focused reactions
Get focused reactions specific to the types of feelings or perspectives you feel are important.
Evaluate an experience
Test specific moments within any user journey and get participants to share how they felt about an experience.
Click Test
Find out how participants interact with early concept designs or production-ready screens. Validate micro-moments within a flow to create building blocks for improving any experience.
Live Example
Identify influencing elements
Find elements on your page that catch a participant’s eyes first. Click maps in the report reveal patterns immediately.
Adjust your information hierarchy
Discover where your information hierarchy needs adjustments based on how people react to specific directives.
Optimize a screen flow
Figure out how people move through a series of click tests you string together using clickable hotspots.

Multiple Choice
Understand your audience’s choices from a variety of specific options, such as behaviors or impressions in a specific scenario.
Live Example
Quick conclusions
Get answers and draw actionable conclusions in minutes.
Understanding your audience
Multiple Choice can be a great tool to get more information about your audience in how they think, what they prefer, and what their preferences are.
Test your hunches
Have a quirky hunch you want to get out of your system? This is one of the fastest ways to validate or invalidate it!

Free-response
Have participants share things they care about or learn how they think about your creative ideas.
Live Example
Understanding perceptions
Listen to participants grievances outside of customer support.
Evaluate comprehension
Gauge comprehension of ideas and designs from people. With our automated sentiment analysis, it’s quick to interpret the data.
Open up the problem
Ask participants about their daily routines, their hopes and fears, or simply their preferences. Let them go on a tangent – you never know what you’ll discover!

Get the answers you need instantly
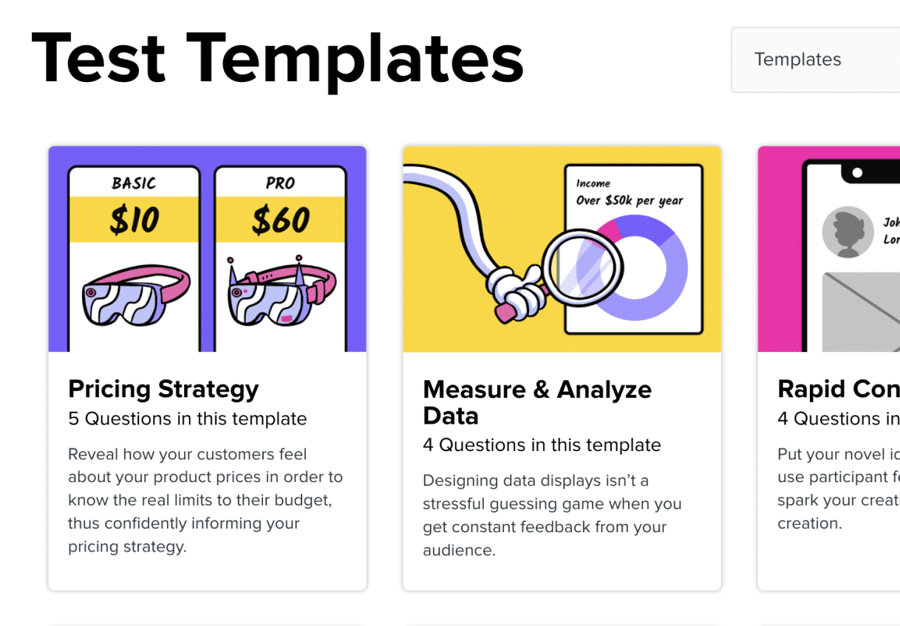
Launch a test in minutes
Create a test quickly with Helio’s user-friendly platform and ready-to-use templates. Put your test in front of your users effortlessly.
Watch participants respond in real time
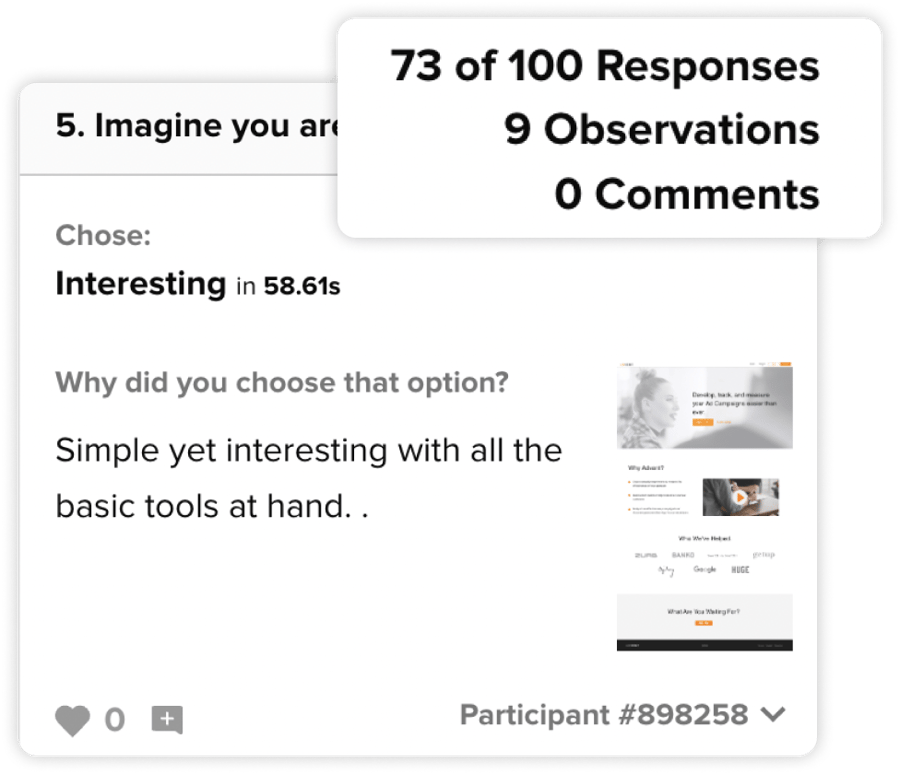
Once the responses start rolling in, view the individual responses on the right and data rollups on the left.
Filter responses using different tools
Filter the data reports by clicking on participant answers, demographics, response time, and sentiment.
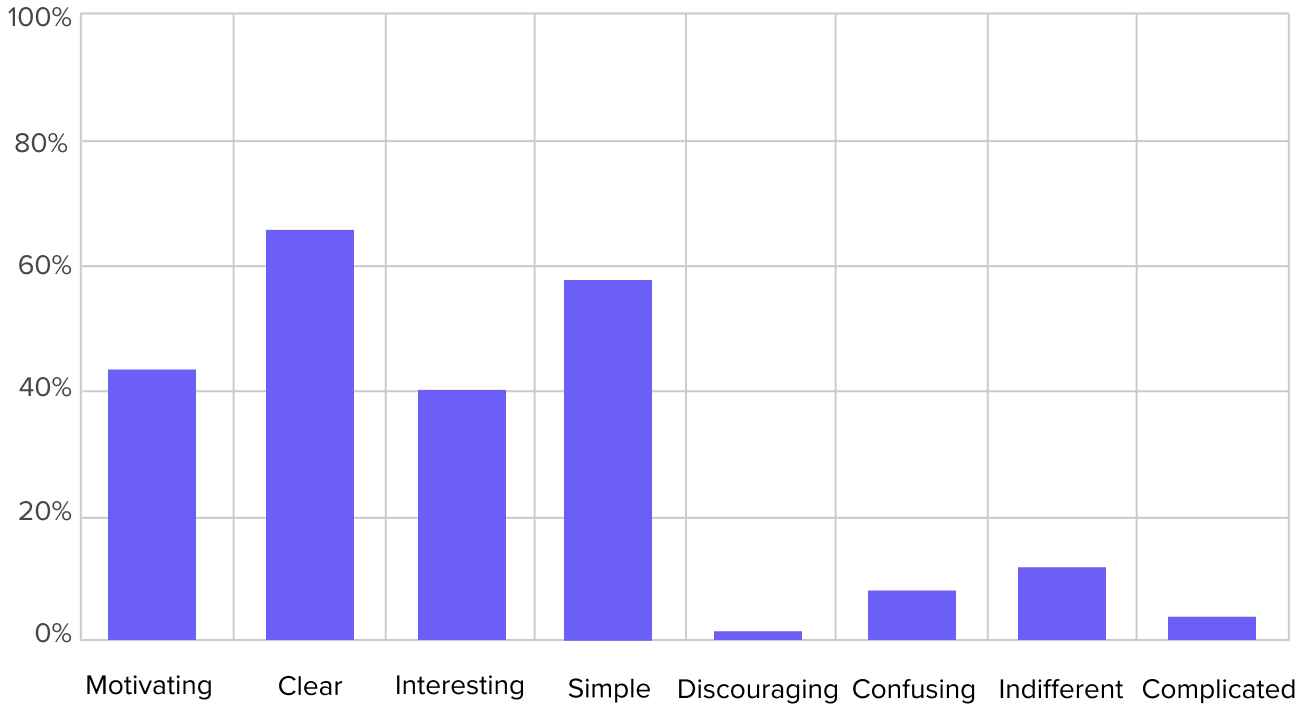
Spot differences in the segmented data
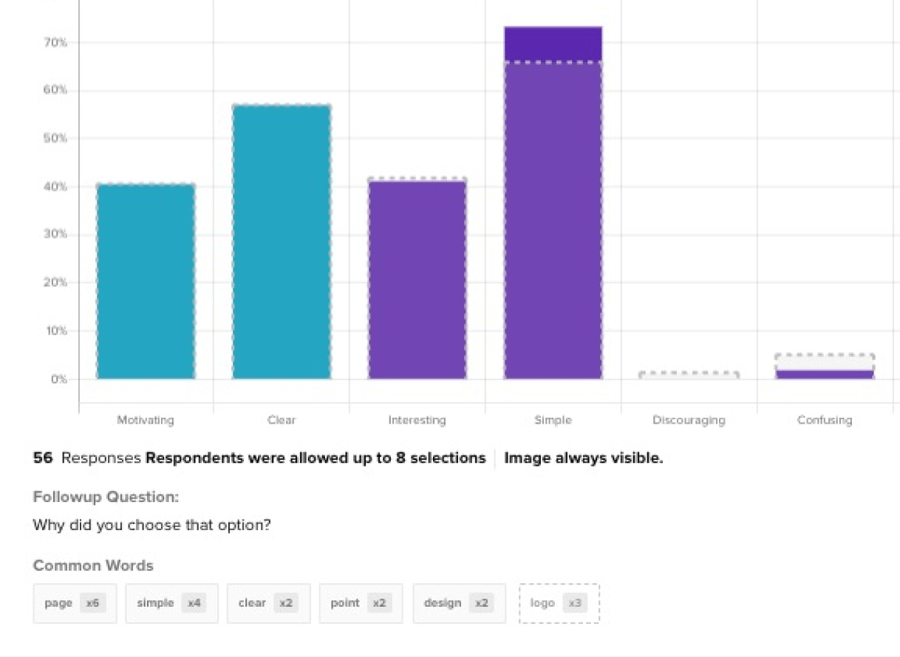
View segmented data in charts that overlap with your original participant data to spot immediate differences.
Streamline your product learning
Get real-time report updates with each response
Watch as Helio instantly updates your report summary whenever new responses come in. Stay in the loop with bite-sized info that keeps you up to date!
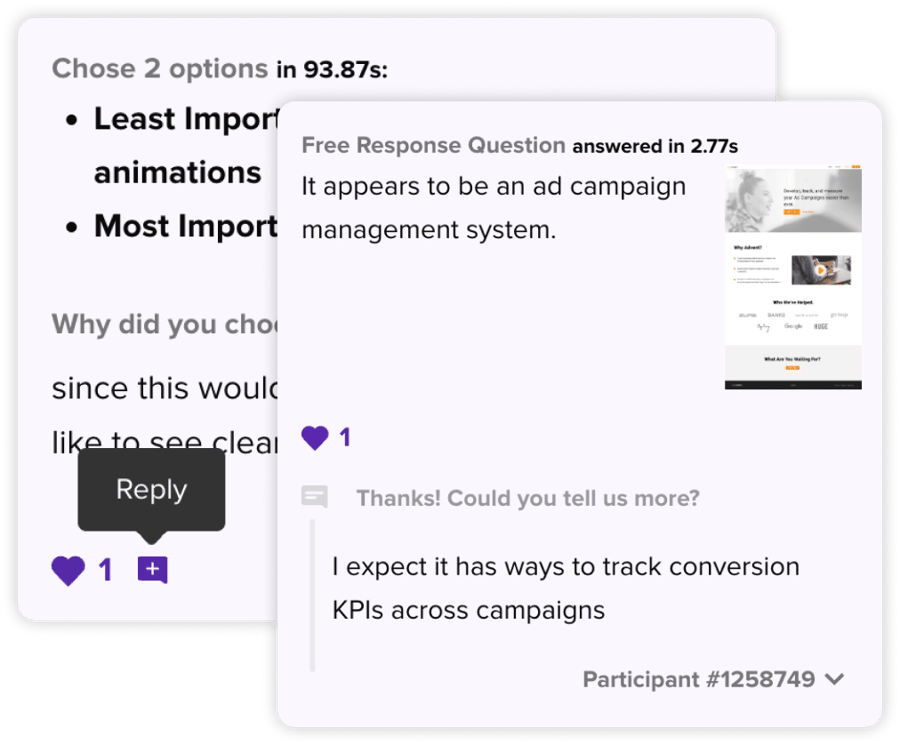
Follow up with participants
Create observations that link to your data view. Share observations that reveal your insights with clarity and granularity.
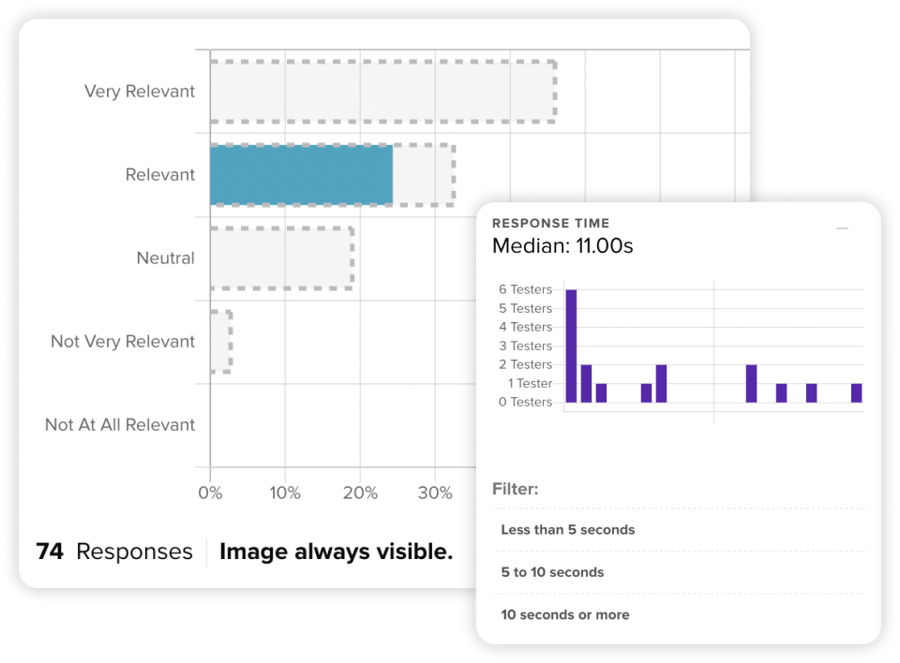
Advanced filtering reveals instant insights
Use the filter panel to sort participant data by clicking on participant answers, demographics, response time, and sentiment—spot instant insights.
The perfect balance of qualitative and quantitative data
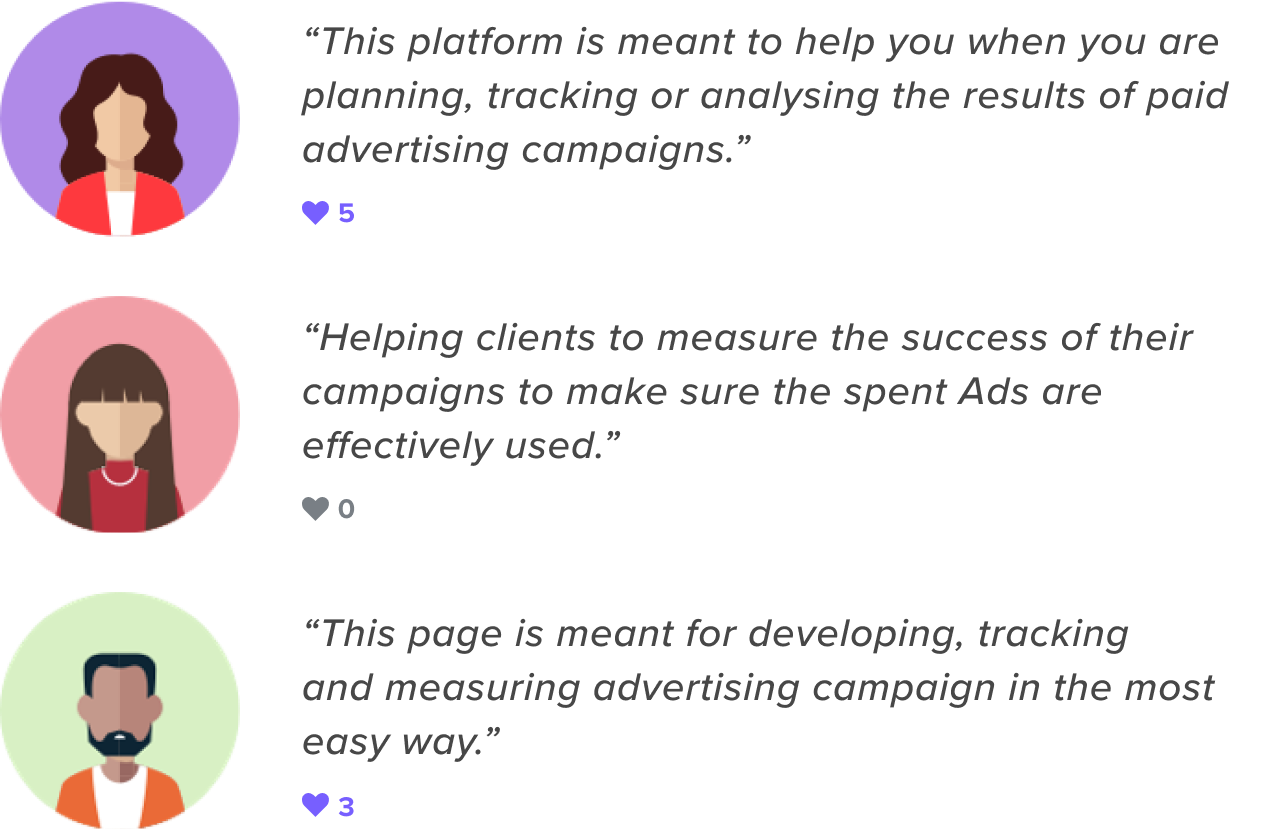
View data charts next to the participant’s responses. Quickly get the why behind the data by reviewing participant follow-up answers.
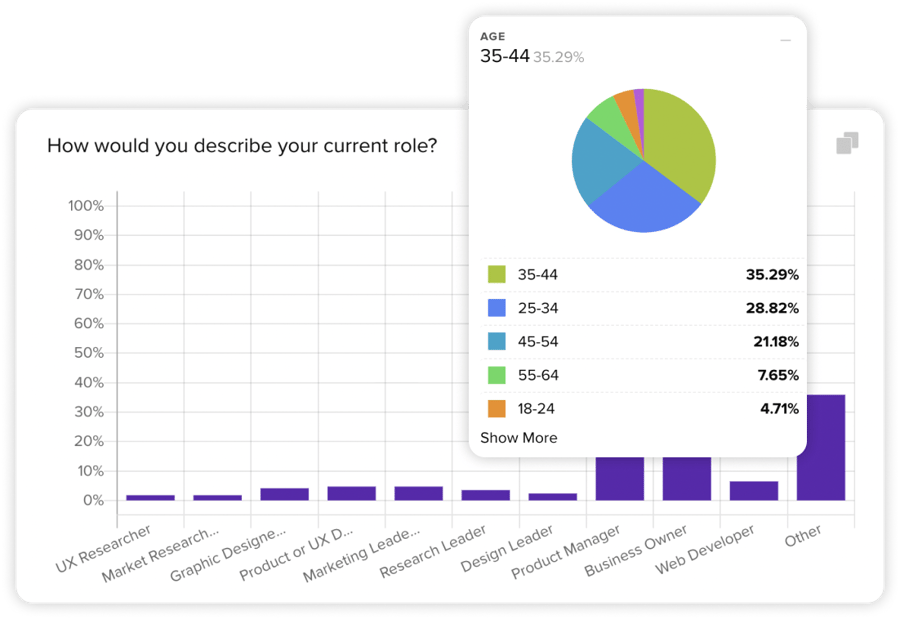
Dig deeper into each participant
View participants’ individual demographics and responses to your tests to understand why people think the way they do.
Create valuable observations that remember your view
Create observations that link to your data view. Share observations that reveal your insights with clarity and granularity.
Helio’s quick turnaround time is impressive. The speed at which we receive data is significantly faster than what we’ve experienced with traditional market research. Getting insights almost in real-time is exciting and crucial for our work.

-Kevin Dunn, LevLane

Question Graphs

Question Drilldown

Realtime Responses

Robust Filtering

Qualitative Responses

Data Charting

CSV Export

Observation Citations
FAQs
Helio offers a user-friendly platform and ready-to-use templates so you can launch a test in minutes.
Helio provides a filter panel to sort participant data by clicking on participant answers, demographics, response time, and sentiment.
Helio charts can be updated with filtered overlaps to help you quickly see segment differences.