Drive your research with quantitative clarity
Turn user feedback into actionable metrics and confidently chart your product’s path.

Data-Driven Decisions at a Glance
Access comprehensive quantitative data rollups that simplify complex user feedback into digestible metrics. Leverage these insights to pinpoint user behavior trends and streamline product decision-making.
Instant Browser-Based Testing
Get real-time, behavioral analytics without any cumbersome setups or installations. Our platform captures user interactions seamlessly, enabling you to monitor prototype performances and identify areas of improvement immediately.
Robust Data Charting and Reports
Visualize quantitative data through intuitive charts and graphs, making pattern recognition a breeze. Additionally, export detailed CSV reports to delve deeper, ensuring no insight goes unnoticed.
Drive your iterations forward with automated data

Realtime data reports

Product discovery with automated metrics

Transform data into a team sport
Helio is lean, mean data machine
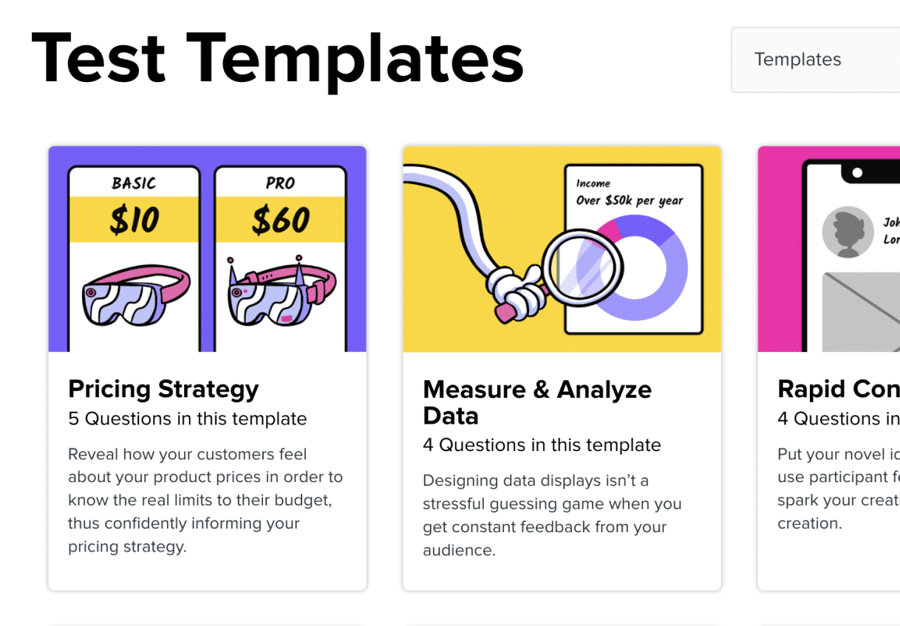
Launch a test in minutes
Create a test quickly with Helio’s user-friendly platform and ready-to-use templates. Put your test in front of your users effortlessly.
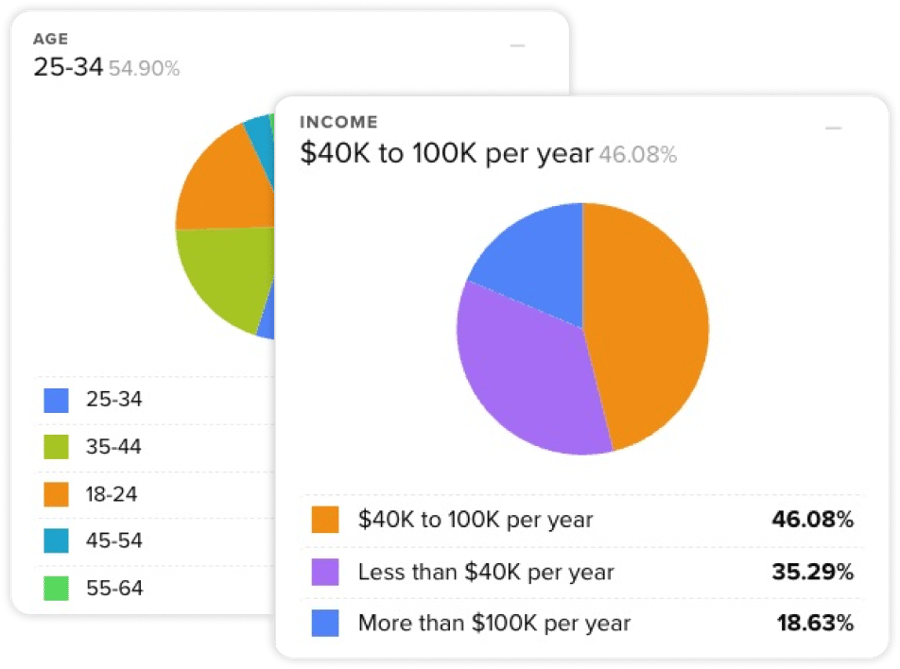
View data with various chart types
Once the responses start rolling in, view data rollups based on usability or survey question types.
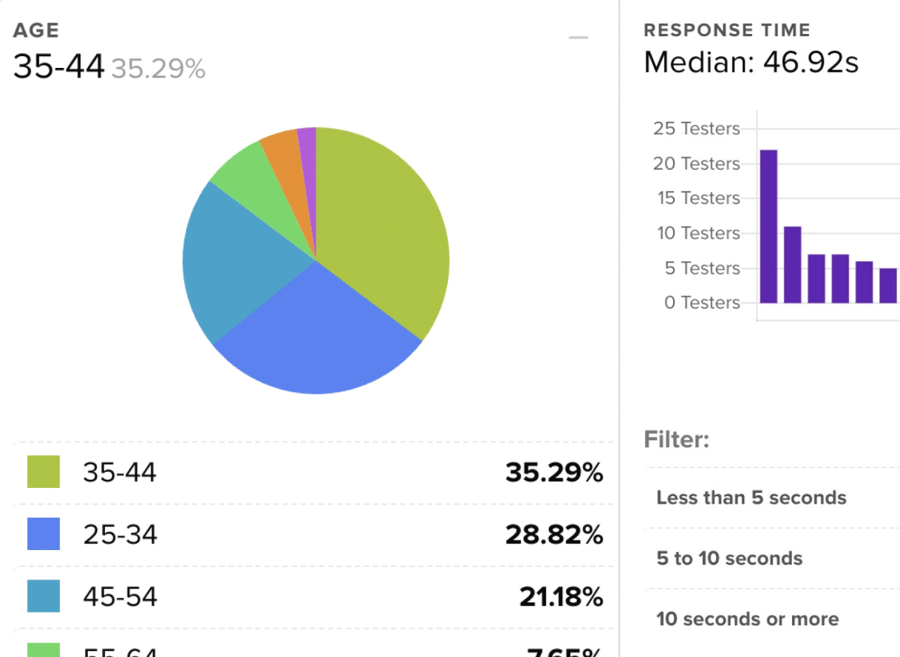
Filter responses using different tools
Filter the data reports by clicking on participant answers, demographics, response time, and sentiment.
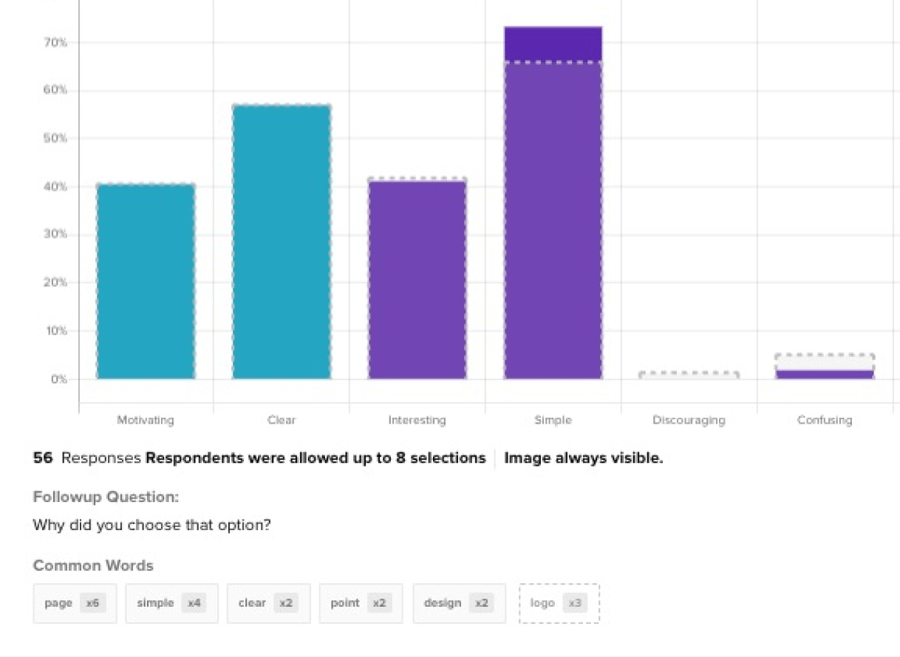
Spot differences in the segmented data
View segmented data in charts that overlap with your original participant data to spot immediate differences.
Turn traditional research into data-driven insights
Receive Live Report Updates for Each Response
Experience Helio’s real-time report refreshes as new feedback rolls in. Stay informed with concise details, always keeping you ahead!
Advanced filtering reveals instant insights
Harness the filter panel to categorize participant data—be it based on answers, demographics, response time, or sentiment—and unveil immediate insights.
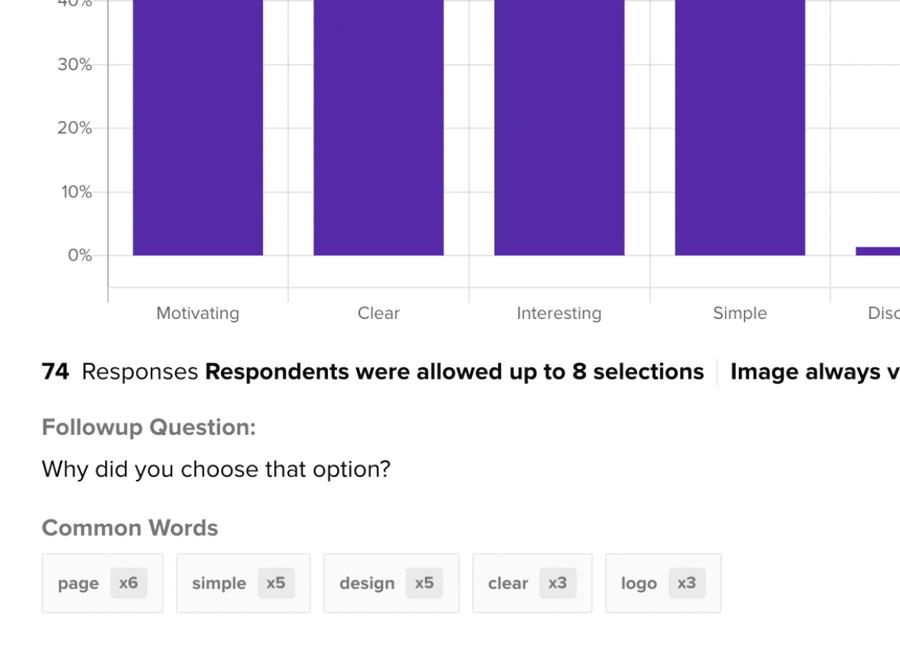
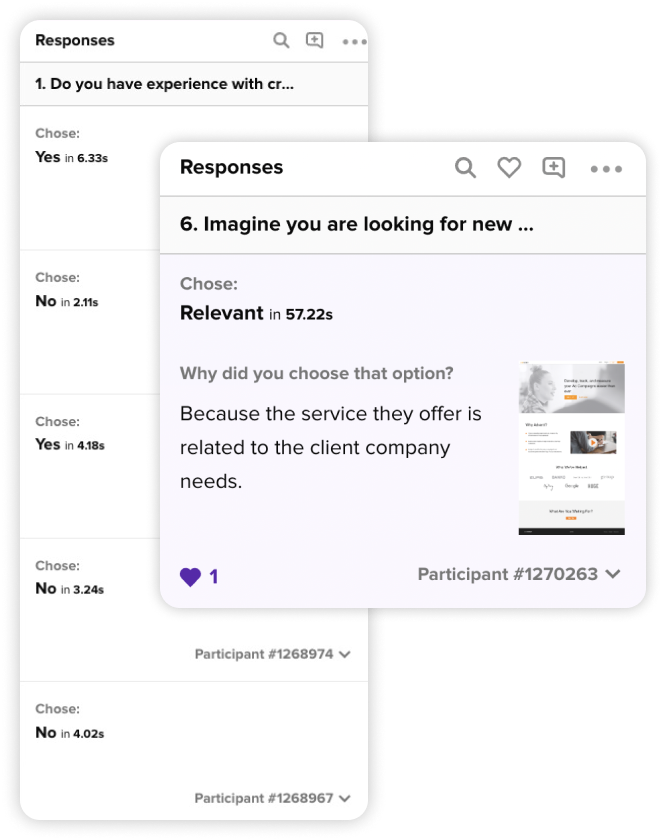
The perfect balance of qualitative and quantitative data
Juxtapose data charts with participant feedback. Unravel the ‘why’ behind numbers with participant follow-up responses.
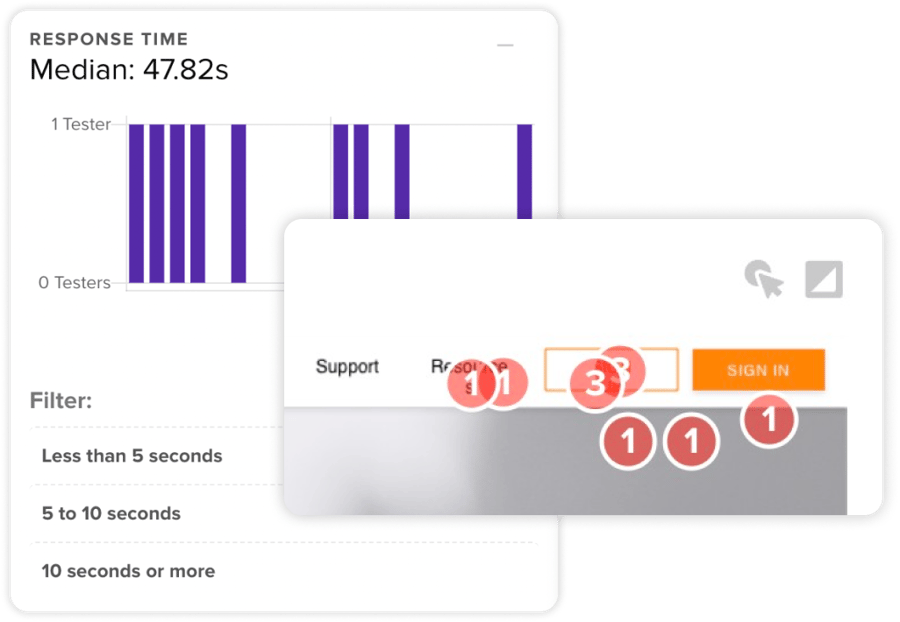
Automated metrics that drive discovery
Helio equips you to translate feedback into actionable insights. From tracking bounce rates and misclicks to visualizing clickmaps, access vivid real-time data ready for swift team actions.

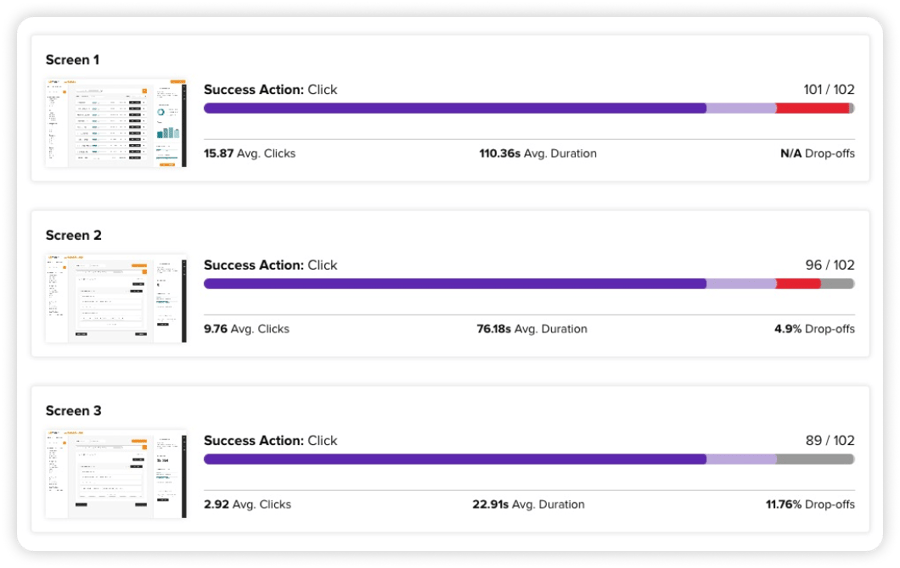
Uncover Primary Actions Taken by Your Users
Uncover Primary Actions Taken by Your Users Helio’s usability testing demystifies user behavior, from the initial clicks to intricate pathways. Equip your team with vibrant real-time data, translating into actionable insights within mere hours.
We reached a point of overthinking with the team, becoming stuck in a state of analysis paralysis. Now we have Helio research to suggest a specific course of action, convincing us why the button should be blue. It’s a simple approach to test it and see what yields the best results.

Christina Maguire, Radiance

Clickmaps

Usability Score

Prototype Metrics

Instant Browser-Based Testing

Robust Filtering

Data Charting

CSV Reports

Response Time
FAQs
Quantitative data provides a numerical and statistical analysis of survey results, allowing product managers to understand user behavior and preferences in measurable terms.
Quantitative Data lets you objectively measure user feedback, identify trends, and make data-driven decisions. This ensures that your product decisions are rooted in factual insights rather than assumptions.
Our platform is designed for speed and efficiency. Once your survey is started, quantitative data results are available in real time, providing you with actionable insights within minutes.
Yes! Our platform offers a range of quantitative metrics like usability scores, clickmaps, and more.
While qualitative data gives you insights into the ‘why’ and ‘how’ behind user behavior, quantitative data focuses on the ‘what’. It provides measurable and numerical data that can be statistically analyzed, such as the number of users who liked a particular feature.
Absolutely! Our platform supports exporting of data in CSV format, allowing you to analyze the data further or share it with your team using tools of your preference.
Helio prioritizes data accuracy. Our advanced algorithms and robust filtering systems assure you that the quantitative insights you receive are precise and reliable.