Interpreting Gravity Score Test Results
Synthesizing a gravity score survey follows the same approach as a SUS Report Test. In order to calculate the score, you’ll need to download the CSV version of your test results from Helio.
Once you have the CSV, follow these steps to synthesize the data:
STEP 1
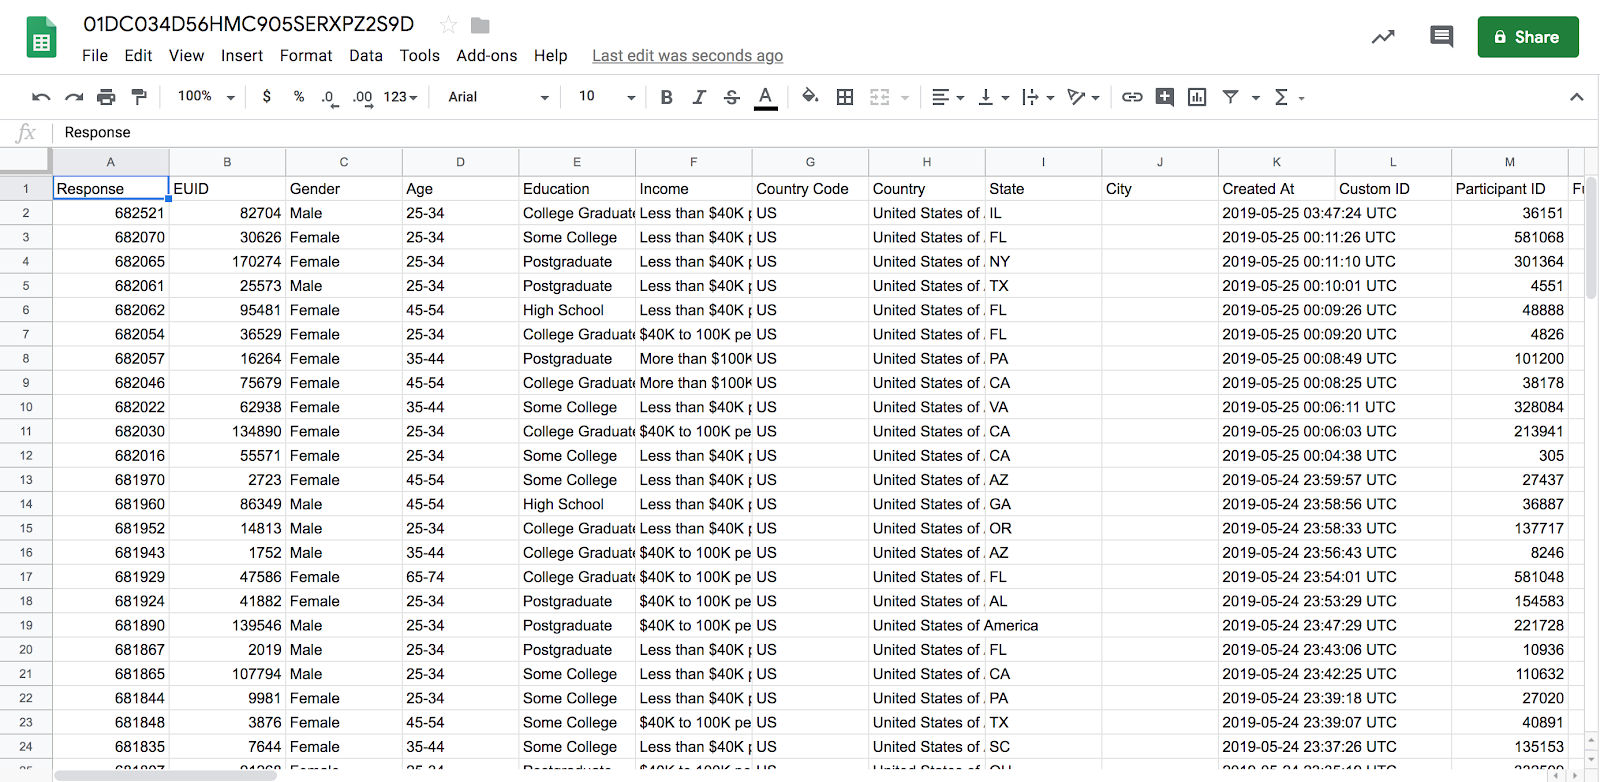
Open your Helio data CSV in a spreadsheet. It should look something like this:
We use Google Sheets for our data formatting, which you can use as well by copying our Gravity Score template.
STEP 2
Delete all columns except for the Likert choices. This includes the tester demographic information, response time, and any empty columns. It should then look something like this:

STEP 3
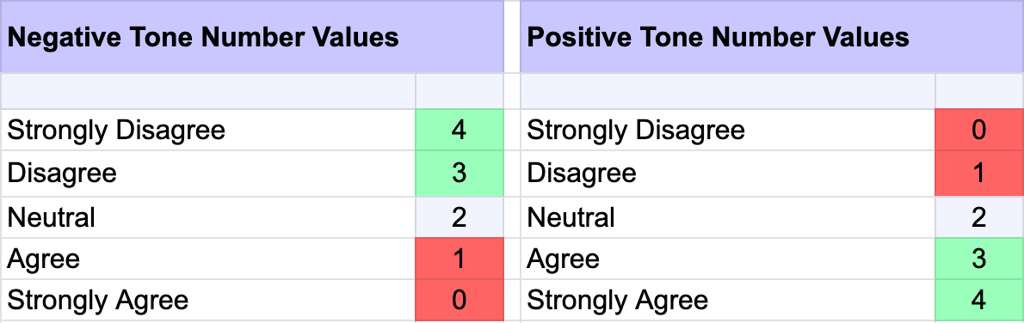
Convert each Likert response to a corresponding number value. The number values listed below are based on the negative or positive inflection of the question. Reminder that these positive and negative questions alternate back and forth in the survey, starting with a positive statement.
Helpful Tip:
The Find & Replace action in Google Sheets allows for quick replacement and can be done column by column. Click the letter at the top of the column you’re working on, and then select ‘Find and Replace’ from the Edit menu. Type in the answer choice you’d like to convert (Strongly Agree), and then the number value you want to replace it with (0 or 4, depending on the tone of the question). The ‘Neutral’ answer is universally valued at ‘2’, so that can be a global replacement rather than going column by column.

STEP 4
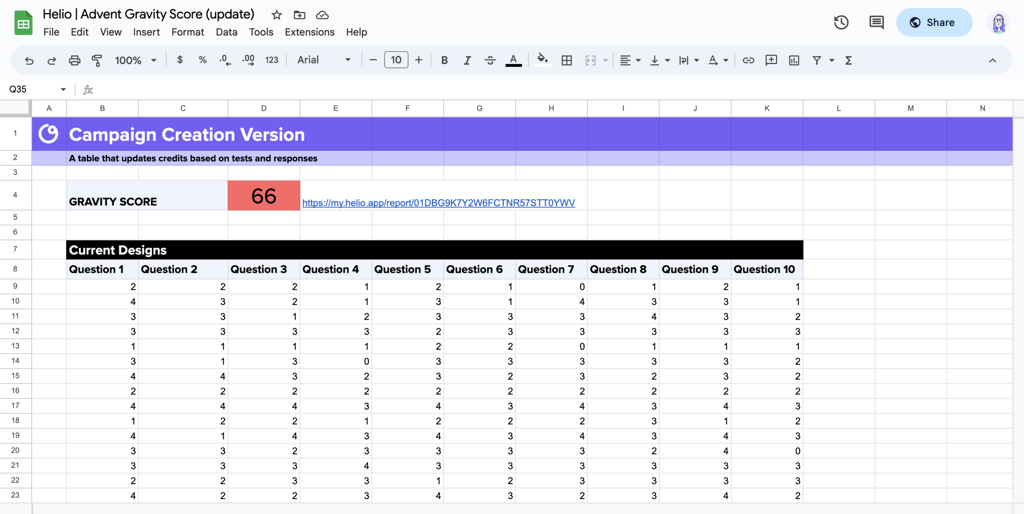
Transfer the number values to the tab in your Gravity Score framework you’ve reserved for that design. After translating the responses to numbers in the previous step, you should be able to highlight all the boxes that contain the number values and copy/paste them directly under the question columns in your Gravity Score framework (pictured below).
STEP 5
Calculate the average for each question column, then add them up. This formula is pre-set in the Gravity Score template, and the averages will appear automatically below the number columns on that tab.

Following SUS testing protocols, the average of each column should then be added up to a single total value.
STEP 6
Calculate the Gravity Score by multiplying the sum of the averages in the previous step by 2.5. Again, this follows the typical SUS testing practices, and produces a score somewhere between 0-100. Your Helio Gravity Scores will likely fall within the range of 60 to 80 points.
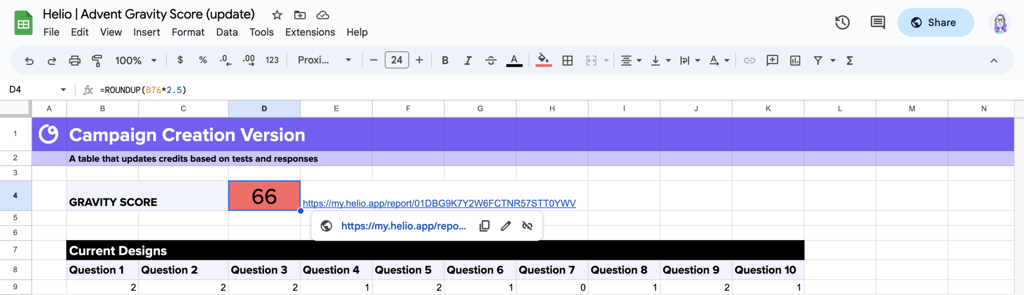
Now you have calculated the Gravity Score and produced a usability measurement of this design on your platform. Like the rest of the framework, the Gravity Score will be automatically highlighted by the color representing its overall success.
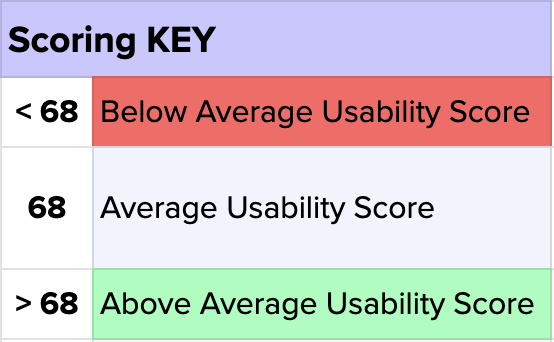
A score of 68 is average based on SUS testing principles, and we’ve provided a success key in the Gravity Score template so you can easily interpret your scores.
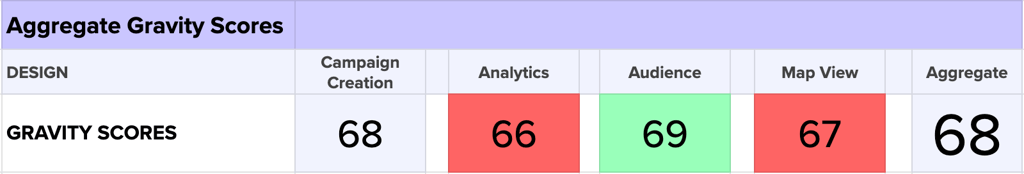
Follow the 6 steps above to test each design from your platform and produce usability scores for each part of the user experience. The collection of these scores are then entered into the SUS Summary tab in the Gravity Score framework to give you an average usability score for each design and your platform overall.
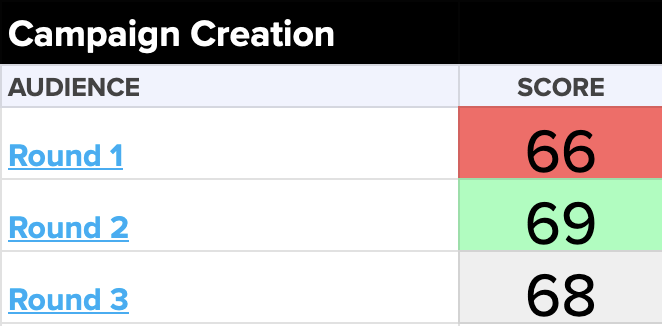
As you make changes to your designs based on the areas of improvement you’ve identified, you can do additional rounds of testing on your designs to measure success over time. For our ad management platform Advent, we did 3 rounds of Gravity Score testing for each page.
Page 1
Page 2
Page 3
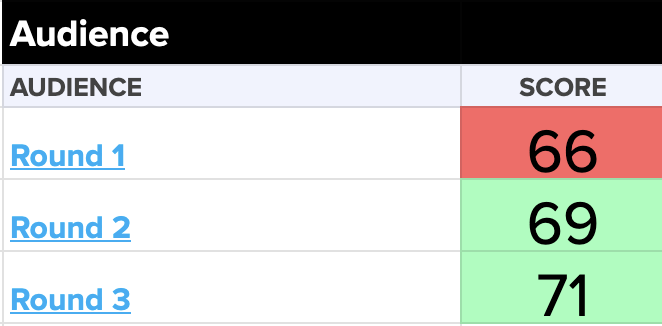
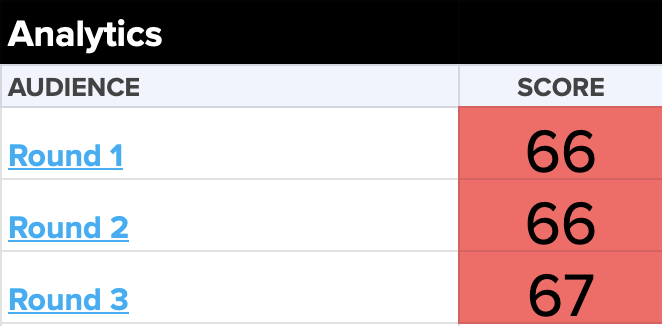
The Audience page on Advent saw the most improvement over the 3 rounds, while the Analytics page data is showing that we haven’t found the right solution there yet.
Once you’ve got your first round of data on the books, we have several tips on how to present and sell the data to your team. Check out the following section in our guide!