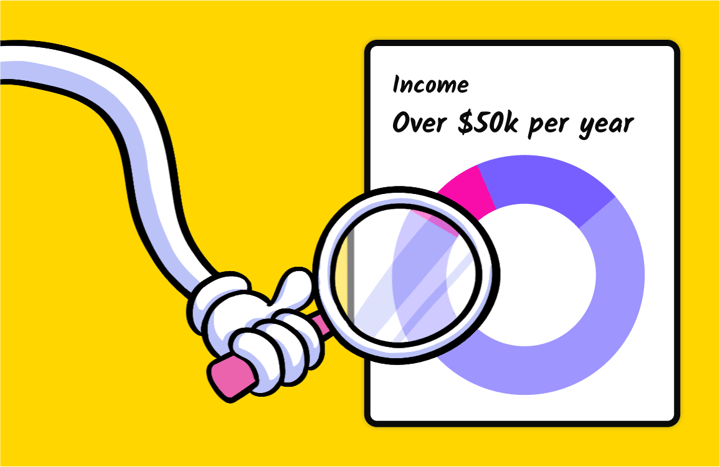
Product Development Test Template
Measure & Analyze Data
Why should you use this template?
For those of us who love data, and what it can show us, diving into analytics is an exciting venture. However, there are many who dread crunching numbers for their job, and need a helping hand when it comes to putting these numbers to use.
It can be a daunting task trying to get a lot of quantitative information through to a user in a short amount of time. Once you’ve designed a system for this data delivery, it’s important to get feedback from your user audience to determine how clear the information is.
Testing your data and analytics designs will usually come in the form of usability or comprehension testing. Click tests can be key, but also allowing your participants to openly explain their opinions about your work is illuminating.
Testing Outcomes
- Measure the clarity of your data graphics or displays
- Analyze the importance of the different information your product brings to the table
- Evaluate the difficulties participants have with your designs
Organization Benefits
- Increasing the clarity of your designs will lead to greater engagement from your audience
- Prioritizing different parts of your data & analytics can change how participants interact with your product
Test Questions
- How well do you understand what this graphic is showing?
Likert Scale
Start with a general comprehension measure of your data & analytics displays. Pairing this quantitative question with an open response follow-up allows you to compare what participants think they know versus what they actually can explain. - Click where you would go to change this…
Click Test
Now that you’ve gotten a written example of your audience’s comprehension, put their actions to the test with click directives. Figma prototypes are also a great option for this testing if you’re an Enterprise member! - Rank these data points in order from Most Important to Least Important.
Rank Order
If you have several types of information you’re trying to get across in one place, see which your audience needs to be elevated in terms of importance. - What does this information mean for your team?
Free Response
Once you’ve gotten feedback on your data & analytics as a collective, use free responses to narrow down your focus and get participants to explain the value they see in their own words.
Additional Questions
- How well do you understand what this information is showing?
- Briefly describe what this data is showing.
- What is most challenging about this information graphic?
- What is most clear about this information graphic?
- What is one thing you would change about this data display?
- What does this information mean for your team?
- Click where you would go to take action on this data display.
- Rank these data points from Most Clear to Least Clear based on your understanding.
- Which of these data points needs your attention first on this page?
- Select the Most Important and Least Important data points on this page.


