
Analyzing
A design method for discovering behavioral patterns in apps and websites.
![]() . 5 min read
. 5 min read
The nuts and bolts: Analyzing is a user research method of breaking down a complex topic or website into smaller parts to get an understanding of behavioral patterns. Although analysis as a formal concept is a recent development, it has been used in the study of mathematics and logic since before Aristotle.

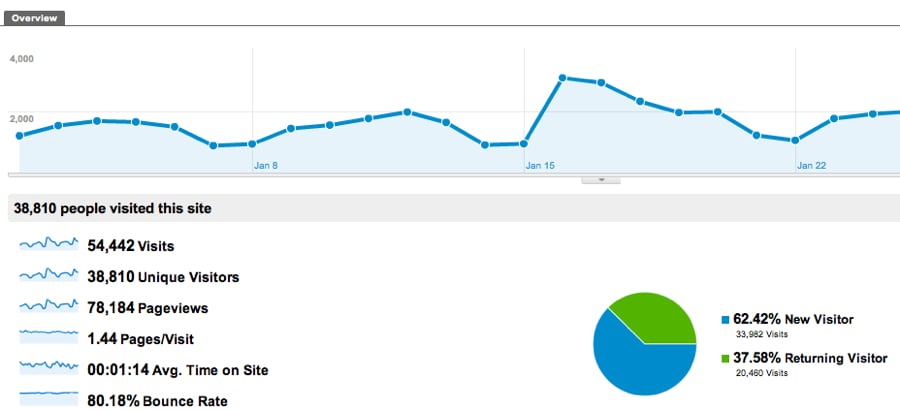
What do people really think of you and your product? You could interview them and ask — that would only tell us what they say they think. The amazing thing about digital products is you can collect a ridiculous amount of data about how people actually behave while using them. You’ll have cold, hard numbers that describe their behavior.
The trouble is you can drown in a flood of data if you don’t know how to swim with the numbers. You can get the most everyday benefit by diving in and becoming addicted to three data points:
-
- Figure out what drives traffic to your site
- Watch the trends closely to make sure they are trending up
- Track which content generates the most attention
Armed with those three things, you can make some quick and reasonably informed decisions based on how your users are reacting. You’ll understand what people expect, know where you’re headed, and what things you do actually matter to people.
We’ve used this light analytics method to figure out that people really grooved to our thoughts on implementing cool stuff in forward-thinking code. Seeing traffic build around blog posts like Super Awesome Buttons or pages like Polaroids with CSS3 helped us decide to double down on ZURB’s Playground and, eventually, opened up opportunities for our code framework Foundation.
But your analysis shouldn’t stop there.
Digging Deeper
There is more to analytics than just reading three kinds of data sets every day. Most people fail right there and don’t translate numbers into decisions on a regular basis, so it’s worth stressing you need to tread water and make analytics a habit first!
Once you get hooked and learn to swim, an entire field of analytics opens up to you. There are tools for not only measuring on-site or in-app behavior — which we’re referring to in this article — but also off-site or external behavior of your potential audience (e.g. reach, shares, tweets, comments). There is demographic data you can slice by regions of the world, flow data illustrating common navigation paths through pages or screens, customer lifecycle data mapping visitors across various touch points over time — the list goes on.
Let’s stay practical and rooted in what’s somewhat familiar and most likely to generate the most bang for your time and energy right now: on-site analytics for web apps.
Say your company is having a decent amount of success and has already been collecting a lot of data, but nobody has been keeping track. Maybe three or four different people helped set up Google Analytics, Optimizer, Salesforce, and other tools at different times, but none of them are around anymore to ask. What do you do?
How do You Approach a Mountain of Data?
First, admit you don’t know anything. Clear your mind. Seek a zen-like state and prepare to go looking. Your strategy is to look across all the data, see broad patterns and note key events, and then plan out deeper dives into the data based on those initial insights.
Using the patterns and events you find, you can rinse and repeat the exercise to look in more focused subsets of data and see what valid patterns emerge. This is where we start to form our first hypotheses like, “Could it be that none of the people signing up actually arrive from the top two sources that account for 60% of all traffic?”
A recent example for us came while working with an enterprise infrastructure company. They do the software that helps companies blow up in popularity without slowing down and crashing along the way. Armed with mountains of data across seven different applications, they had hunches they were losing opportunity all over the place but didn’t know where or why.
By diving in with an open mind, we started noticing interesting things right away. About half of the insights from our first pass were easily explained away with further questioning — things like tracking codes that weren’t installed properly across a portion of the site until August that caused big drops or jumps in certain metrics — but the other half gave us indicators where to look next.
All of their sales leads happened in one section of their site and involved one single pattern of behavior: users would download two kinds of files, then get in touch with sales. More interesting still, the majority of traffic going to that section of their site never performed those actions at all.
These indicators told us to look hard at traffic sources, the flow between three partner sites, and behavior within different sections of the main site. From there we later learned only a subset of the entire audience would convert to a paying customer and that a handful of pages drew these would-be customers attention but we’re letting them down. This was data we were able to act on.
Crunching the Data
Starting from the top, we try to look in broad strokes at the data and see events or patterns emerge. A quick list of data we look for is
- Is data even tracking right now? Answers the ubiquitous “is this thing on” question. You’d be surprised how often there are gaps.
- Is traffic trending up or down over a time frame of weeks or months? Indicates the trajectory your site is on. Easy to overlook or downplay because it is a trend over time, not a sexy one-time event. Don’t overlook it!
- Are there spikes? Spikes aren’t that interesting in themselves. They typically indicate PR events where somebody spent money for eyeballs, but not engagement (hence the “spike” drops). You can, however, forage comments from referring sources to get first impressions of new visitors. TechCrunch is a great example.
- Are there plateaus? Plateaus are more interesting. They imply a change event that stuck. This can be for good or bad. Sites like Digg and Gawker experienced sudden negative changes in traffic corresponding to failed product relaunches. On the positive side, we’ve seen a leap in business growth from launching features like search or browse.
Where is all this traffic coming from?
- Who are the top referring sources? How much of the total traffic do they contribute? Go look at those top sites.
- Note the actual pages on those sites that link to yours. What do people expect to find when clicking those links? Does your site fulfill that expectation?
- Does your traffic come disproportionately from one geographic area? Could language translation of certain pages be an opportunity you haven’t considered?
- What search terms do people use to find you? What does that say about their expectation for your site and your fulfillment of it?
What is your top content?
- Which sections of the site generate the most interest? Unique visitors, page views, and time on site are great indicators to measure.
- Which grab the least attention? Is it because nobody wants that information or because they can’t find that information, either by navigation or poor search optimization?
Where are people engaging the most? The least?
- Which sources, sections, and pages generate the most page views and highest time on site? This indicates highly interested or motivated visitors. What patterns can we find here? If we compare this engagement data in our other slices, what can we learn about each group?
- Which pages have the highest bounce rate? This indicates a page that was so unfulfilling, the person left your site without bothering to browse even a second page.
- Which pages have the highest exit rate? This shows points where people browsing your site “finished” and left.
What are the common flows through your site? Subsequent actions?
Google Analytics’ visitor flow offers a fluid chart showing common connections between groups of pages. This lets us infer workflow groupings we can try and optimize.
Based on the info we get from this broad first pass, we’ll lather, rinse, and repeat again in smaller subsets of data. What do we mean by that?
Take the insight that you find from two different traffic sources, which between both of them account for over 50% of all of your site’s traffic. Your second step will involve slicing the data by each referring site and then run through the same data questions: what are the trends, top content, engagement metrics, and flows for just the people arriving from each referring site?
Now that you have some data to compare based on source, you can start forming some assumptions and hypotheses about who these two sets of people are, why they’re here, and judge how well each is performing.
Looking For Clues
Analyzing data continues to surprise and excite us each time we use it. Our site’s visitors are spilling their guts each day to try and tell us what they want and why they are here. We just need to look and listen to them. There are all sorts of clues about what we should be doing next.
Whenever we use analytics, we always round it out with other methods. Customer interviews help confirm some of our hypotheses from the data and provide more detailed, emotional, and qualitative data to help explain who we’re serving and why. Live User Testing also lets us observe individual instances of behavior across the same sites, apps, and workflows we measure in the data.
Of course, we also use Helio to quickly reach out to our target audience for answers. We even have an easy peasy test template just for analyzing.
Together these methods help triangulate our customers’ expectations and behaviors. They reinforce our understanding of the people we’re designing for so that we can deliver kick-ass products that help them get things done and not frustrate them or waste their time!