
Understand the Cross Tabulation (Crosstab)
![]() Helio Editorial Team . 5 min read
Helio Editorial Team . 5 min read
Cross tabulation is a powerful tool in data analysis that allows you to explore the relationship between two or more variables. Cross tabulation provides a clear and concise way of presenting information by organizing data into a table format. Understanding cross tabulation can greatly enhance your data analysis skills as a student, researcher, or business professional.
🔩 The Nuts and Bolts:
- Cross tabulation is a powerful tool in data analysis to explore relationships between two or more variables.
- It involves categorizing data into rows and columns to create a table that shows the frequency or distribution of one variable based on another.
- The steps involved in cross tabulation include selecting variables, creating the table, entering data, and analyzing results.
- When interpreting results, it’s important to consider other factors and potential biases/confounding variables.
- More advanced techniques such as cross tabulating multiple variables and using statistical software are also available.
Defining Cross Tabulation
At its core, cross tabulation involves categorizing data into rows and columns to create a table that shows the frequency or distribution of one variable based on another. This enables you to observe patterns, trends, and associations between variables that may not be apparent when looking at individual data points.
Cross tabulation is a powerful analytical technique that provides a structured way to analyze and interpret data. It is commonly used in various fields such as market research, social sciences, and business analytics.
The Basics of Cross Tabulation
Before we dive into the details of cross tabulation, let’s discuss the basic components. The table consists of rows, which represent one variable, and columns, which represent another variable. The intersection of a row and column contains the count or percentage of observations that fall into that particular combination of variables.
Consider a simple example where we want to examine the relationship between gender and favorite color. The rows would represent gender (male, female), and the columns would represent colors (red, blue, green). The table would display the count or percentage of individuals in each gender category who prefer a specific color.
🚀 If you’re using Helio
Quickly cross tabulate responses across different demographic segments using Filters in the data report.
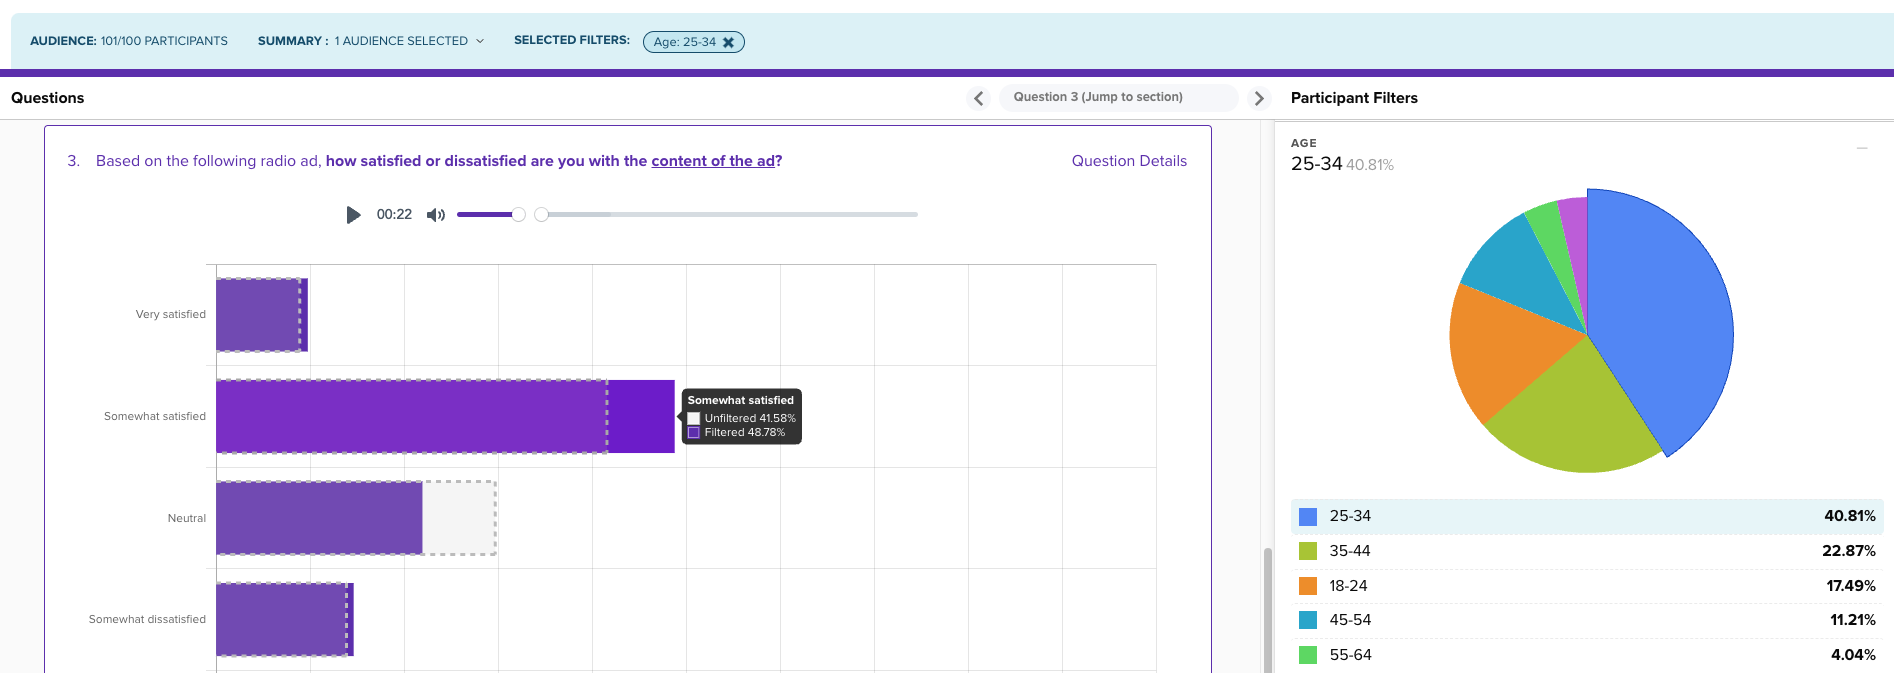
Select demographic segments of your audience to compare survey reactions.
Cross tabulation allows us to examine the relationship between variables in a structured and organized manner. Visualizing the data in a table format makes it easier to identify patterns and draw meaningful conclusions.
The Importance of Cross Tabulation in Data Analysis
Cross tabulation is integral to data analysis, allowing you to explore relationships and test hypotheses. By examining the association between variables, you can gain insights into the underlying patterns in your data. This knowledge can help guide decision-making, identify trends, and support future research.
For example, in market research, cross tabulation can reveal consumer preferences, behaviors, and demographics. By understanding how different variables interact, businesses can tailor their products, services, and marketing strategies to specific target markets.
In social sciences, cross tabulation is used to study the relationship between various demographic factors and social phenomena. It helps researchers understand the impact of different variables on outcomes and allows for a deeper understanding of complex social dynamics.
Furthermore, cross tabulation can identify potential biases or disparities in data. By examining the distribution of variables across different groups, researchers can uncover hidden patterns of inequality or discrimination.
Overall, cross tabulation provides a comprehensive and systematic approach to analyzing data. It allows researchers to explore relationships, discover insights, and make informed decisions based on evidence. Whether conducting market research, studying social phenomena, or analyzing business data, cross tabulation is valuable in your analytical toolkit.
The Process of Cross Tabulation
Now that we have a basic understanding of cross tabulation, let’s walk through the process of performing it.
Preparing Data for Cross Tabulation
Before you can start cross tabulating your data, ensuring it is organized and clean is crucial. This may involve data cleaning, such as removing duplicates or correcting errors, and merging or transforming data sets to align variables properly.
For example, if you are working with survey data, you might need to check for missing values and decide how to handle them. You might also need to recode variables to ensure consistency in the compared categories.
Additionally, you must have a clear research question or objective. Knowing what you want to explore will guide your selection of variables and help you interpret the results.
For instance, if you are interested in examining the relationship between gender and voting preferences, your research question might be: “Is there a difference in voting preferences between males and females?” This question will guide your choice of variables and how you interpret the cross tabulation results.
Drive your marketing research forward with Helio
Get insights from your target audience in minutes
Steps in Performing Cross Tabulation
Performing cross tabulation involves several steps:
- Select the variables you want to cross tabulate. These variables should be relevant to your research question or objective.
- Create a table with rows and columns representing the selected variables.
- Enter the data into the table, counting or calculating each category’s frequency or percentage of observations.
- Analyze the results by interpreting the patterns, trends, and associations revealed in the table.
Let’s dive deeper into each step:
Step 1: Selecting Variables
Choosing the right variables is crucial for an effective cross tabulation analysis. The variables you select should directly relate to your research question or objective. They should also have distinct categories that can be compared and analyzed.
For example, if you are studying the relationship between education level and income, your variables would be “education level” and “income.” The education level variable might have categories like “high school diploma,” “bachelor’s degree,” and “master’s degree,” while the income variable might have categories like “less than $30,000,” “$30,000 – $50,000,” and “over $50,000.”
Step 2: Creating the Cross Tabulation Table
Once you have selected your variables, you must create a table to serve as the basis for your cross tabulation. The table should have rows and columns representing the selected variables.
For example, if you are cross tabulating education level and income, you would create a table with education level as the rows and income as the columns. Each cell in the table will represent the intersection of a specific education level category and income category.
By organizing the data in this way, you can easily compare income distribution across different education levels.
Step 3: Entering the Data
Enter the data into the appropriate cells once you have created the cross tabulation table. This involves counting or calculating each category’s frequency or percentage of observations.
For example, if you have survey data on education level and income, you would count the number of respondents in each education level category and income category and enter those counts into the corresponding cells of the table.
Calculate the percentage of respondents in each category to better understand the distribution.
Step 4: Analyzing the Results
It’s time to analyze the results after entering the data into the cross tabulation table. This involves interpreting the patterns, trends, and associations revealed in the table.
For example, individuals with higher education levels tend to have higher incomes. This association can be seen by comparing the percentages or counts in the different cells of the table.
By analyzing the results, you can gain valuable insights into the relationship between the variables you cross tabulated. These insights can inform decision-making, identify patterns, or support further research.
Following these steps, you can systematically explore the relationship between variables and gain valuable insights from your data.
🚀 If you’re using Helio
Load data into one of our data comparison frameworks with our data copy tool.
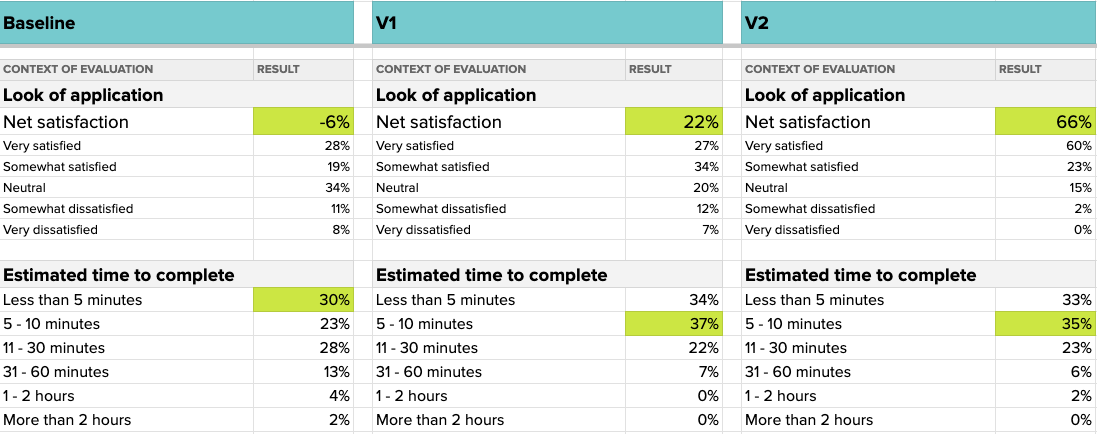
Check out our Helio Methods for frameworks to collect your data.
Interpreting Cross Tabulation Results
Once you have performed cross tabulation and have a results table, it’s time to interpret the findings. This involves reading and understanding the table and making inferences based on observed patterns.
Reading and Understanding Cross Tabulation Tables
When reading a cross tabulation table, paying attention to the row and column categories is essential. These represent the variables and their respective categories. Look for patterns, such as higher frequencies or percentages in certain combinations, indicating a relationship between the variables.
For example, in our gender and favorite color example, if most males prefer blue and most females prefer red, this suggests a potential association between gender and color preference.
Making Inferences from Cross Tabulation Data
While cross tabulation can reveal associations between variables, it is important to note that correlation does not imply causation. It is essential to consider other factors and conduct further analysis to establish a cause-and-effect relationship.
Furthermore, when interpreting cross tabulation results, be aware of any biases or confounding variables that may influence the observed associations. Understanding the limitations of your data and analysis is crucial in drawing accurate conclusions.
Survey Creation 101
Benefits and Limitations of Cross Tabulation
Like any analytical tool, cross tabulation has its advantages and limitations.
Advantages of Using Cross Tabulation
Cross tabulation offers several benefits:
- Clear Visualization: The table format provides a concise and visual representation of the data, making it easier to understand and communicate.
- Quick Identification of Patterns: Cross tabulation lets you quickly identify patterns, relationships, and differences between variables, facilitating hypothesis generation and exploration.
- Flexibility: Cross tabulation can be applied to categorical and numerical variables, making it a versatile tool in data analysis.
Potential Drawbacks and Misinterpretations
While cross tabulation is a valuable tool, it does have limitations:
- Limited Statistical Analysis: Cross tabulation primarily focuses on displaying frequency or distribution, limiting the depth of statistical analysis that can be performed.
- Small Sample Sizes: In cases where the sample size is small, the results of cross tabulation may not be statistically significant, leading to unreliable conclusions.
- Misinterpretations: The presence of confounding variables or biased data can lead to misinterpretations of the relationships observed in the cross tabulation table.
Awareness of these limitations can help you use cross tabulation effectively while avoiding potential pitfalls.
Make your design decisions count.
Subscribe to Design Under Pressure. Get insights, UX metrics, and tools for bold, informed design.
We respect your inbox. Just insights. No fluff. Privacy Policy.
Advanced Cross Tabulation Techniques
Once you have mastered the basics of cross tabulation, you can explore more advanced techniques.
Cross Tabulation with Multiple Variables
While traditional cross tabulation involves two variables, extending the analysis to include more variables is possible. Adding additional rows or columns allows you to examine how multiple variables interact and influence each other.
For example, in a survey about customer satisfaction, you could cross tabulate variables such as age, gender, and product preference to identify any relationships or differences across demographic groups.
Cross Tabulation in Statistical Software
Statistical software packages such as SPSS, R, and Excel offer built-in functions for cross tabulation. These tools automate the process, allowing you to perform cross tabulation efficiently and easily explore complex relationships.
Additionally, statistical software often provides advanced statistical tests, such as chi-square tests, to assess the statistical significance of the observed associations.
Conclusion
Cross tabulation is a valuable technique that provides insights into the relationship between variables. Cross tabulation allows you to easily visualize your data’s patterns, trends, and associations by organizing data into a table format.
Understanding the basics of cross tabulation, the process of performing it, and how to interpret the results are crucial skills for anyone involved in data analysis. Consider the advantages and limitations of cross tabulation, and explore advanced techniques to uncover more complex relationships.
With this comprehensive guide, you can unlock the full potential of cross tabulation in your data analysis endeavors.
FAQs
Cross tabulation is a powerful tool in data analysis that allows you to explore the relationship between two or more variables. It involves categorizing data into rows and columns to create a table that shows the frequency or distribution of one variable based on another.
The steps involved in cross tabulation include selecting variables, creating the table, entering data, and analyzing results.
Cross tabulation is integral to data analysis, allowing you to explore relationships and test hypotheses. By examining the association between variables, you can gain insights into the underlying patterns in your data. This knowledge can help guide decision-making, identify trends, and support future research.
Choosing the right variables is crucial for an effective cross tabulation analysis. The variables you select should directly relate to your research question or objective and have distinct categories to compare and analyze.
A5: Interpreting cross tabulation results involves reading and understanding the table and making inferences based on observed patterns. It is important to note that correlation does not imply causation and to consider other factors and potential biases when concluding.
A6: Cross tabulation offers several benefits, such as clear visualization, quick identification of patterns, and flexibility. However, it also has potential drawbacks, such as limited statistical analysis, small sample sizes, and misinterpretations.
Cross tabulation is a powerful tool in data analysis that allows you to explore the relationship between two or more variables. It involves categorizing data into rows and columns to create a table that shows the frequency or distribution of one variable based on another.
The steps involved in cross tabulation include selecting variables, creating the table, entering data, and analyzing results.
Cross tabulation is integral to data analysis, allowing you to explore relationships and test hypotheses. By examining the association between variables, you can gain insights into the underlying patterns in your data. This knowledge can help guide decision-making, identify trends, and support future research.
Choosing the right variables is crucial for an effective cross tabulation analysis. The variables you select should directly relate to your research question or objective and have distinct categories to compare and analyze.
Interpreting cross tabulation results involves reading and understanding the table and making inferences based on observed patterns. It is important to note that correlation does not imply causation and to consider other factors and potential biases when concluding.
Cross tabulation offers several benefits, such as clear visualization, quick identification of patterns, and flexibility. However, it also has potential drawbacks, such as limited statistical analysis, small sample sizes, and misinterpretations.