
How to Use a Top 2 Box Score in Your Survey Analysis
![]() Helio Editorial Team . 5 min read
Helio Editorial Team . 5 min read
When it comes to analyzing survey data, many tools and techniques are at your disposal. One such tool is the Top 2 Box score, which can provide valuable insights into your respondents’ preferences and opinions. In this article, we will explore the Top 2 Box score concept, how to calculate it, and most importantly, how to use it effectively in your survey analysis. So, let’s dive in!
🔩 The Nuts and Bolts:
- The Top 2 Box score summarizes survey responses by focusing on the percentage of respondents who fall within the top two categories of a rating scale.
- It provides valuable insights into customer satisfaction, brand perception, or any other area you measure through your survey.
- To calculate the Top 2 Box score, first collect survey data from your target audience and then sort and rank the responses according to their ratings on a scale.
- A high Top 2 Box score indicates a high level of agreement or satisfaction among respondents, while a low one suggests areas where improvements are needed.
- Strategies for enhancing the Top 2 Box score include paying attention to survey design and boosting response rates.
- Common misconceptions and mistakes when using the Top 2 Box score should be avoided to ensure accurate results.
Understanding the Top 2 Box Score Concept
Before we delve into the details, let’s first clarify the Top 2 Box score. In essence, it is a method of summarizing survey responses. Instead of looking at each response, the Top 2 Box score focuses on responses that fall within the top two rating scale categories.
Finding effective ways to condense the information without losing valuable insights is important when analyzing survey data. The Top 2 Box score allows researchers to do just that. By aggregating the responses in the top two categories, it provides a high-level overview of the sentiment or satisfaction levels among the respondents.
Let’s say you conducted a customer satisfaction survey and asked participants to rate their experience on a scale of 1 to 5, with 1 being “Very Dissatisfied” and 5 being “Very Satisfied.” Instead of analyzing each individual rating, the Top 2 Box score would focus on the percentage of respondents who selected either “Very Satisfied” (5) or “Satisfied” (4). This approach simplifies the analysis process and highlights the most positive responses.
Definition of Top 2 Box Score
The Top 2 Box score is calculated by combining the percentage of respondents who selected the top category, typically “Strongly Agree” or “Very Satisfied,” with the percentage of those who chose the second-highest category, such as “Agree” or “Satisfied.”
Let’s consider an example to illustrate this calculation. Suppose you conducted a survey asking participants to rate their likelihood of recommending a product on a scale of 1 to 10, with 1 being “Not at all likely” and 10 being “Extremely likely.” To calculate the Top 2 Box score, you would add the percentage of respondents who selected either 9 or 10 (indicating high likelihood of recommendation) and those who chose 8 (indicating moderate likelihood of recommendation).
By combining these two categories, you can get a comprehensive view of the percentage of highly likely or moderately likely respondents to recommend the product. This score provides a valuable metric for assessing the overall positive sentiment towards the product.
Drive your marketing research forward with Helio
Get insights from your target audience in minutes
Importance of Top 2 Box Score in Survey Analysis
Why should you pay attention to the Top 2 Box score? It provides a quick and easy way to gauge your respondents’ overall satisfaction or agreement levels. By focusing on the most positive responses, you can clearly understand how well your survey meets your target audience’s expectations or preferences.
Understanding the sentiments of your respondents is crucial for making informed decisions. The Top 2 Box score allows you to identify the proportion of highly satisfied respondents who strongly agree with a particular statement or question in your survey. This information can help you identify areas of strength and areas that may need improvement.
For example, if you conduct a customer feedback survey for a restaurant, the Top 2 Box score can reveal the percentage of customers who are extremely satisfied with the quality of food and service. This insight can guide you in maintaining and enhancing those aspects your customers highly value.
Furthermore, the Top 2 Box score can be used to track changes over time. By comparing the scores from different time periods or different groups, you can identify trends and patterns in customer satisfaction or agreement levels. This data-driven approach enables you to make data-backed decisions and continuously improve your offerings.
In conclusion, the Top 2 Box score is a valuable tool in survey analysis. It allows researchers to summarize survey responses efficiently and gain insights into overall satisfaction or agreement levels. By focusing on the most positive responses, you can identify areas of strength and areas for improvement, ultimately leading to better decision-making and enhanced customer experiences.
Make your design decisions count.
Subscribe to Design Under Pressure. Get insights, UX metrics, and tools for bold, informed design.
We respect your inbox. Just insights. No fluff. Privacy Policy.
Steps to Calculate a Top 2 Box Score
Now that we have a solid understanding of the concept, let’s walk through the steps to calculate a Top 2 Box score.
Calculating a Top 2 Box score is valuable for analyzing survey data. It allows you to identify the percentage of respondents who fall within the top two categories of a rating scale. This can provide valuable insights into customer satisfaction, brand perception, or any other area you measure through your survey.
Gathering Your Survey Data
The first step is to collect your survey responses. This can be done with Helio. Collecting these survey responses involves reaching out to your target audience (or an on-demand audience) and encouraging them to participate in your survey. It is important to ensure a sufficient sample size to make your analysis statistically reliable. A larger sample size will provide more accurate results and reduce the margin of error.
When designing your survey questions, it is crucial to remember the rating scale you will use for each question. The Top 2 Box score focuses on the top two rating scale categories, so choosing a scale that allows respondents to express their opinions clearly is important. Common rating scales include Likert scales, semantic differential scales, and numerical scales.
Sorting and Ranking Your Responses
Once you have gathered your data, it’s time to sort and rank your responses. This step involves grouping together the responses that fall within the top two categories of your rating scale. By doing this, you can identify the percentage of respondents who have expressed the highest levels of satisfaction or agreement.
Sorting and ranking your responses can be done manually or with the help of data analysis software. Using software can save you time and effort if you have a large dataset. However, if your sample size is small, manually sorting and ranking the responses can be feasible.
Calculating Your Top 2 Box Score
To calculate the Top 2 Box score, you need to add together the percentage of respondents who chose the top category and the percentage of those who selected the second-highest category. This will give you a single score representing the percentage of respondents who fall within the top two categories.
🚀 If you’re using Helio
Quickly select the top 2 selections on your data graphs to get a percentage read-out.
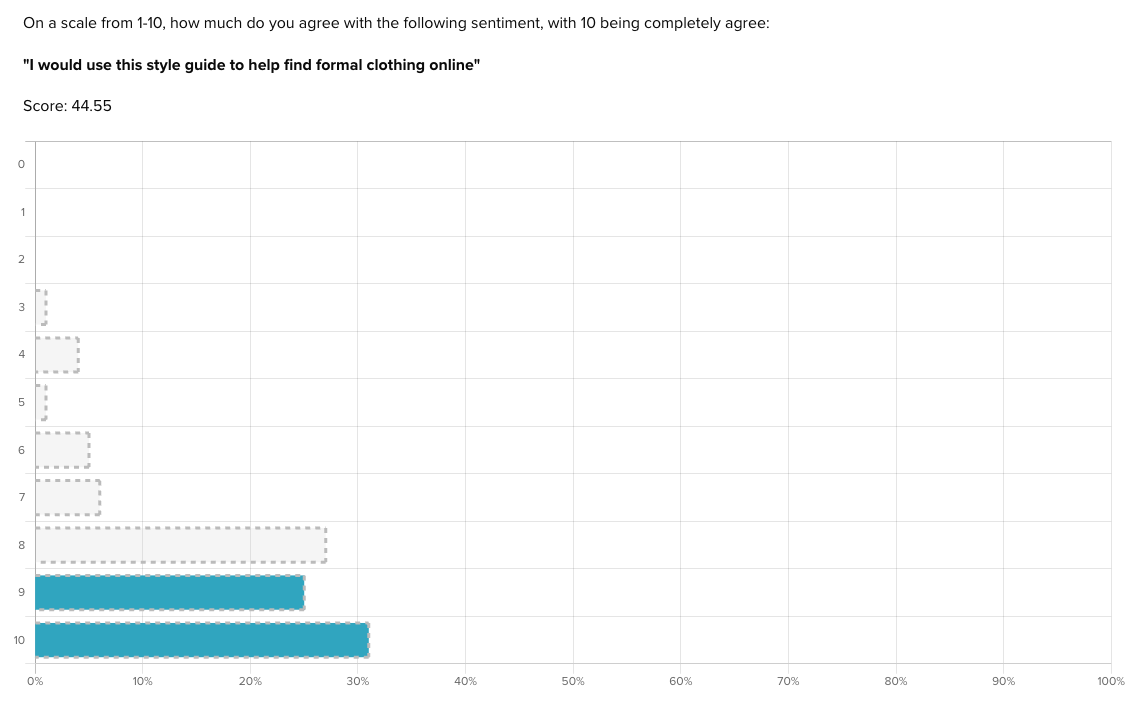
Select data bars on Helio bar graphs allows you to filter and segment your data based on participants’ responses.
For example, if 40% of respondents selected the top category and 30% chose the second-highest category, your Top 2 Box score would be 70%. This means that 70% of respondents fall within the top two categories of your rating scale, indicating high satisfaction or agreement.
Calculating the Top 2 Box score can provide valuable insights into the overall sentiment of your survey respondents. It allows you to focus on the most positive or favorable responses, clearly understanding the areas where you excel.
Following these steps, you can confidently calculate a Top 2 Box score and gain valuable insights from your survey data. Remember to consider the context of your survey and the specific goals you are trying to achieve. This will help you interpret the results accurately and make informed decisions based on the data.
Interpreting Your Top 2 Box Score
Now that you have your Top 2 Box score, what does it mean? Let’s explore the different interpretations.
What a High Top 2 Box Score Indicates
A high Top 2 Box score indicates a high level of agreement or satisfaction among your respondents. This suggests that your survey has successfully captured their positive sentiments or preferences.
What a Low Top 2 Box Score Indicates
On the other hand, a low Top 2 Box score suggests a low level of agreement or satisfaction. This may indicate areas where improvements are needed or your survey questions may have missed the mark.
Improving Your Top 2 Box Score
Now that you understand the implications of your Top 2 Box score, let’s discuss strategies for improving it.
Strategies for Enhancing Survey Design
One way to boost your Top 2 Box score is to pay attention to your survey design. Ensure your questions are clear, concise, and relevant to your target audience. Avoid bias and ambiguity, which can lead to survey fatigue and inaccurate responses.
Techniques for Boosting Response Rates
Another factor that can impact your Top 2 Box score is the response rate. To ensure a higher response rate, consider incentivizing your survey, keeping it short and engaging, and using multiple channels to reach your audience.
Pitfalls to Avoid When Using Top 2 Box Score
Although the Top 2 Box score can be a valuable tool, there are some common pitfalls that you should be aware of.
Common Misconceptions About Top 2 Box Score
One misconception about the Top 2 Box score is that it represents your respondents’ overall sentiment or satisfaction. While it provides valuable insights, it is important to remember that it does not capture the nuances and diversity of their opinions.
Mistakes in Calculating and Interpreting Top 2 Box Score
Calculating and interpreting the Top 2 Box score may seem straightforward, but errors can occur. Ensure you accurately sort and rank your responses, and double-check your calculations to avoid misinterpreting the results.
In conclusion, the Top 2 Box score is a powerful tool that can help you gain valuable insights from your survey data. By understanding the concept, calculating it accurately, and interpreting it correctly, you can make informed decisions and drive improvements in your survey design. So, harness the power of the Top 2 Box score to enhance your survey analysis!
Survey Creation 101
FAQs
The Top 2 Box score summarizes survey responses by focusing on the percentage of respondents who fall within the top two categories of a rating scale.
The Top 2 Box score is calculated by combining the percentage of respondents who selected the top category, typically “Strongly Agree” or “Very Satisfied,” with the percentage of those who chose the second-highest category, such as “Agree” or “Satisfied.”
A high Top 2 Box score indicates a high level of agreement or satisfaction among respondents.
A low Top 2 Box score suggests areas where improvements are needed.
Strategies for enhancing the Top 2 Box score include paying attention to survey design and boosting response rates.
Common misconceptions about the Top 2 Box score include thinking it represents respondents’ overall sentiment or satisfaction. Mistakes in calculating and interpreting the Top 2 Box score should be avoided to ensure accurate results.