
Usability Metrics for User Experience: A Comprehensive Guide
![]() Helio Editorial Team . 5 min read
Helio Editorial Team . 5 min read
Usability metrics play a crucial role in evaluating and enhancing the user experience of a product or service. These metrics help measure users’ effectiveness, efficiency, and satisfaction while interacting with a system. By analyzing usability metrics, organizations can gain valuable insights into the strengths and weaknesses of their user experience and make informed decisions to improve it. In this comprehensive guide, we will explore the different aspects of usability metrics and how they can be utilized to enhance user experience.
🔩 The Nuts and Bolts:
- Direct Impact on Design Decisions: Usability metrics for user experience provide critical data that influence direct improvements in product design, ensuring that user interfaces are intuitive and effectively meet user needs.
- Enhancement of User Satisfaction: These metrics help identify user pain points and satisfaction levels, guiding modifications that enhance the overall user experience and increase customer loyalty.
- Optimization of Product Usability: By focusing on specific usability metrics such as error rates and task completion times, designers can pinpoint and resolve usability issues, significantly improving the ease of use.
- Facilitation of Data-Driven Strategies: The application of these metrics supports a data-driven approach in UX design, allowing teams to make informed decisions based on empirical evidence rather than assumptions.
- Benchmarking and Performance Tracking: Usability metrics enable organizations to benchmark their products against industry standards or competitors, providing a clear perspective on user experience quality.
- Support for A/B Testing and Iteration: Utilizing usability metrics is crucial for effective A/B testing, helping to choose the best design options based on quantifiable user feedback and behavior patterns.
- Informed Resource Allocation: Insights from these metrics assist in allocating resources more effectively, focusing on areas that have the most significant impact on user experience and business outcomes.
Understanding Usability Metrics
Before diving into the world of usability metrics, it’s important to understand what they are and why they are essential clearly. Usability metrics are quantitative measures that indicate how usable a product or service is. They provide objective data on various aspects of user experience, helping designers and researchers make data-driven decisions.
Usability metrics go beyond subjective opinions and provide concrete evidence of how well a product or service meets user needs. By analyzing these metrics, designers can identify areas for improvement and make informed decisions to enhance the user experience.
Definition and Importance of Usability Metrics
Usability metrics are numerical values that assess a product or service’s ease of use and effectiveness. These metrics range from task completion times and error rates to user satisfaction ratings. They are vital in determining how well users can accomplish their goals and how satisfied they are with the overall experience.
One key reason usability metrics are important is that they help organizations identify usability issues and prioritize improvements. By measuring a product or service’s performance, organizations can pinpoint specific areas that need attention and allocate resources accordingly.
Additionally, usability metrics provide a basis for benchmarking and comparing different designs or iterations of a product. By tracking key metrics over time, organizations can measure the impact of their UX improvements and ensure that their design decisions align with user needs and expectations.
Critical Components of Usability Metrics
Usability metrics consist of several components that provide insights into different aspects of user experience. The key elements include:
- Performance Metrics: These metrics focus on how efficiently users can complete tasks. They measure task completion time, error rates, and navigation speed.
- Issue Metrics: Issue metrics track the number and severity of usability issues users encounter. They help identify recurring problems and prioritize design improvements.
- Satisfaction Metrics: Satisfaction metrics gauge users’ overall satisfaction with the product or service. They can be gathered through surveys, interviews, or rating scales.
Performance metrics provide insights into a product or service’s effectiveness and efficiency. By measuring task completion times, designers can identify bottlenecks and areas for improvement. Error rates help identify areas where users struggle or encounter difficulties, allowing designers to address these issues and enhance the user experience.
Issue metrics play a crucial role in identifying recurring usability issues. By tracking the number and severity of these issues, designers can prioritize their efforts and allocate resources to fix the most critical problems. This ensures that the user experience is continuously improved and optimized.
Satisfaction metrics provide valuable insights into how users perceive and feel about a product or service. Designers can understand user preferences, pain points, and overall satisfaction levels by gathering feedback through surveys, interviews, or rating scales. This information helps guide design decisions and ensures the final product meets user expectations.
In conclusion, usability metrics are essential for evaluating and improving the user experience. By providing objective data on various usability aspects, these metrics enable designers and researchers to make informed decisions and create products and services that meet user needs and expectations.
Make your design decisions count.
Subscribe to Design Under Pressure. Get insights, UX metrics, and tools for bold, informed design.
We respect your inbox. Just insights. No fluff. Privacy Policy.
Types of Usability Metrics
Usability metrics can be categorized into different types, each providing unique insights into the user experience. Let’s take a closer look at these types:
Performance Metrics
Performance metrics measure how efficiently users can accomplish tasks. These metrics include task completion time, error rates, and speed of interaction. By analyzing performance metrics, organizations can identify bottlenecks or areas of improvement in their designs.
For example, task completion time can reveal how quickly users can navigate through a website or complete a specific action. If the completion time is longer than expected, it may indicate that the website’s design or layout needs to be optimized for better efficiency.
On the other hand, error rates can highlight any usability issues that users may encounter while interacting with a product. Organizations can identify patterns and make necessary adjustments to improve the user experience by tracking the number of errors and their frequency.
Speed of interaction is another important performance metric that measures how quickly users can perform actions on a website or application. This metric can help organizations gauge the responsiveness of their designs and make necessary optimizations to reduce any delays or lags.
Issue Metrics
Issue metrics help identify and quantify usability issues encountered by users. These metrics cover the number of errors, severity of problems, and frequency of occurrence. By addressing these issues, organizations can enhance the usability of their products and reduce user frustration.
For instance, organizations can prioritize and address the most critical issues by tracking the number of errors. The severity of the problems can help determine their impact on the overall user experience. Organizations can allocate resources effectively by categorizing issues based on severity to fix the most impactful problems.
The frequency of occurrence of usability issues is also an important metric to consider. By identifying which issues occur most frequently, organizations can focus on resolving those problems that have the highest impact on user satisfaction.
Satisfaction Metrics
Satisfaction metrics provide insights into user satisfaction levels. These metrics can be gathered through surveys, ratings, or user feedback. Organizations can make informed decisions to improve the overall user experience by understanding user satisfaction.
Surveys can be conducted to gather feedback on various aspects of the user experience, such as ease of use, visual appeal, and overall satisfaction. Ratings and reviews can also provide valuable insights into user satisfaction levels. By analyzing this feedback, organizations can identify areas of improvement and prioritize enhancements that will have the most significant impact on user satisfaction.
User feedback is another valuable source of satisfaction metrics. By actively listening to users and addressing their concerns or suggestions, organizations can demonstrate their commitment to improving the user experience and building a loyal user base.
Measuring Usability Metrics
Measuring usability metrics involves gathering data to evaluate the user experience. This data can be collected using various tools and methodologies. Let’s explore some of the commonly used methods:
Tools for Measuring Usability Metrics
There are several tools available that can help you gather usability metrics. These tools can range from simple survey platforms to comprehensive user testing software. Some popular tools include:
- Surveys: Online survey platforms like SurveyMonkey or Google Forms can be used to collect feedback from users.
- Analytics: Analytics tools like Google Analytics or Hotjar provide valuable insights into user behavior and interaction patterns.
- User Testing Software: User testing platforms like UsabilityHub or UserTesting.com allow you to conduct remote usability tests and gather metrics.
Steps in Measuring Usability Metrics
Measuring usability metrics involves a systematic approach to collecting and analyzing data. Here are some general steps to follow:
- Identify Goals: Clearly define the goals and objectives of your usability study. What aspects of user experience do you want to measure?
- Choose Metrics: Select the appropriate metrics that align with your goals. Consider using a combination of performance, issue, and satisfaction metrics.
- Collect Data: Use the selected tools and methodologies to gather data. This can be done through surveys, user testing, or analytics.
- Analyze Results: Analyze the collected data to derive meaningful insights. Look for patterns, trends, and areas of improvement.
- Take Action: Based on the analysis, make informed decisions to enhance the user experience. Address usability issues, optimize user flows, and iterate on design.
Interpreting Usability Metrics
Interpreting usability metrics involves analyzing the collected data to gain insights into the user experience. Let’s explore some essential steps in interpreting usability metrics:
Analyzing Usability Metrics Data
When analyzing usability metrics data, looking for patterns and trends is essential. Identify areas where users are experiencing difficulties or where they excel. Focus on metrics that indicate usability issues or areas for improvement.
Additionally, the data should be segmented based on user demographics or behavior. This can provide valuable insights into how user groups interact with the product or service.
🚀 If you’re using Helio
Provide valuable insights into how user groups interact with the product or service.
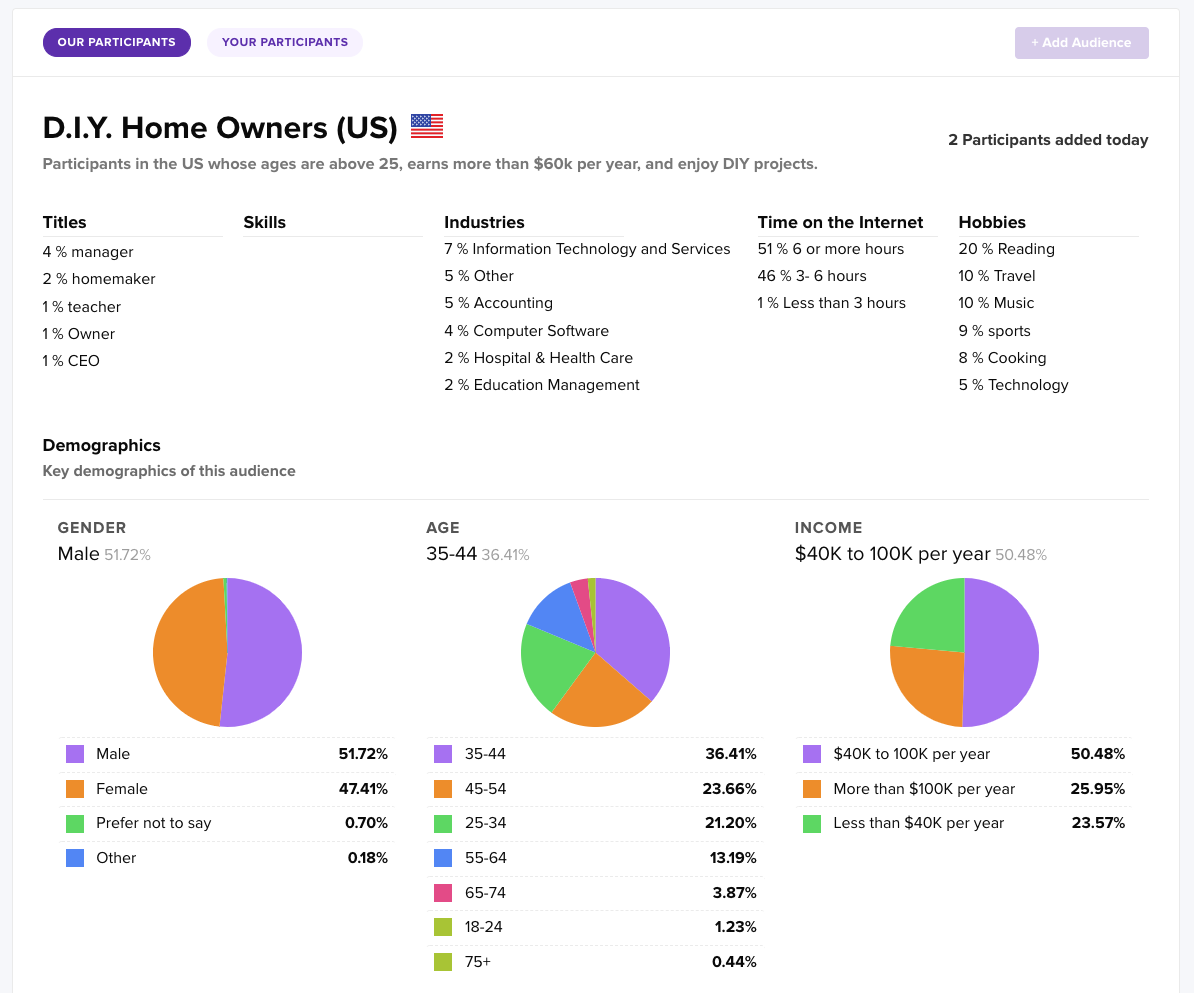
The data should be segmented based on user demographics or behavior.
Making Improvements Based on Usability Metrics
Usability metrics are only valuable if they lead to actionable improvements. Based on the analysis of usability metrics, organizations should prioritize design changes or optimizations that address the identified issues.
Iterate on the design, conduct user testing, and measure the impact of the implemented changes. Usability metrics should be used as a continuous feedback loop to guide and validate design decisions.
Challenges in Using Usability Metrics
Despite the numerous benefits, certain challenges are associated with using usability metrics. Let’s explore some common pitfalls and ways to overcome them:
Common Pitfalls in Using Usability Metrics
One common pitfall is relying solely on quantitative metrics without considering the qualitative aspects of user experience. While numbers provide valuable insights, it’s important to supplement them with user feedback and qualitative data.
Another challenge is the potential bias in data collection. Ensure that the sample size represents the target user group and that data is collected from diverse sources and contexts.
Overcoming Challenges in Usability Metrics
Organizations should adopt a holistic approach to usability metrics to overcome these challenges. They should combine quantitative and qualitative methods to gain a comprehensive understanding of user experience.
Additionally, invest in user research to ensure that data collection methods are unbiased and representative of the target audience. Regularly validate and refine usability metrics to ensure their relevance and effectiveness.
In conclusion, usability metrics are invaluable for evaluating and enhancing the user experience. By understanding the various types of metrics, measuring them effectively, and interpreting the results, organizations can make informed design decisions prioritizing user needs and satisfaction. Despite the challenges, usability metrics provide a solid foundation for creating intuitive, user-friendly products and services.
KEYWORD FAQs
Usability metrics for user experience are quantitative measures that assess how user-friendly and effective a product’s interface is. They are essential because they provide objective data that help improve product design, ensure user satisfaction, and facilitate successful user interactions.
These metrics identify usability issues and areas for enhancement within a product, allowing design teams to make precise adjustments that improve ease of use and overall satisfaction. This leads to a more intuitive and enjoyable user experience.
Standard usability metrics include task completion rate, error rate, time on task, user satisfaction scores (like NPS), and usability testing results. These metrics provide insights into how effectively users can navigate and use a product and how they feel about the interaction.
Effective leveraging of usability metrics can significantly impact a company’s financial performance by increasing user retention, reducing support costs, and enhancing user conversion rates. A better user experience directly correlates with higher customer loyalty and increased revenue.
Companies should consider their specific business goals, the user actions most critical to their product’s success, and the user feedback channels they have available. Choosing the right metrics that align with these factors is crucial for gathering meaningful data.
Usability metrics should be reviewed and updated regularly, ideally after any significant design change or at least once every quarter. This regular review helps ensure the metrics remain relevant and aligned with user expectations and market conditions.
Challenges may include data overload, difficulty interpreting data, and stakeholder resistance. These can be mitigated by focusing on key metrics, providing clear reports and visualizations highlighting essential findings, and involving stakeholders in the metric selection and review process to ensure alignment and support.