
Observe real buyer behavior
Run a usage and attitude test to understand customer interactions and satisfaction. Identify improvements and guide product development with buyer behavior

Up-To-Date Insights
Collect current data to spot patterns in how customers interact and buy.
Enhanced Product Discovery
Use customer insights to guide your product design and prioritize features.
Smarter Decisions
Stay ahead of market trends and use user insights to gain a competitive edge.
Map to UX Metrics

Usefulness

Engagement Rate

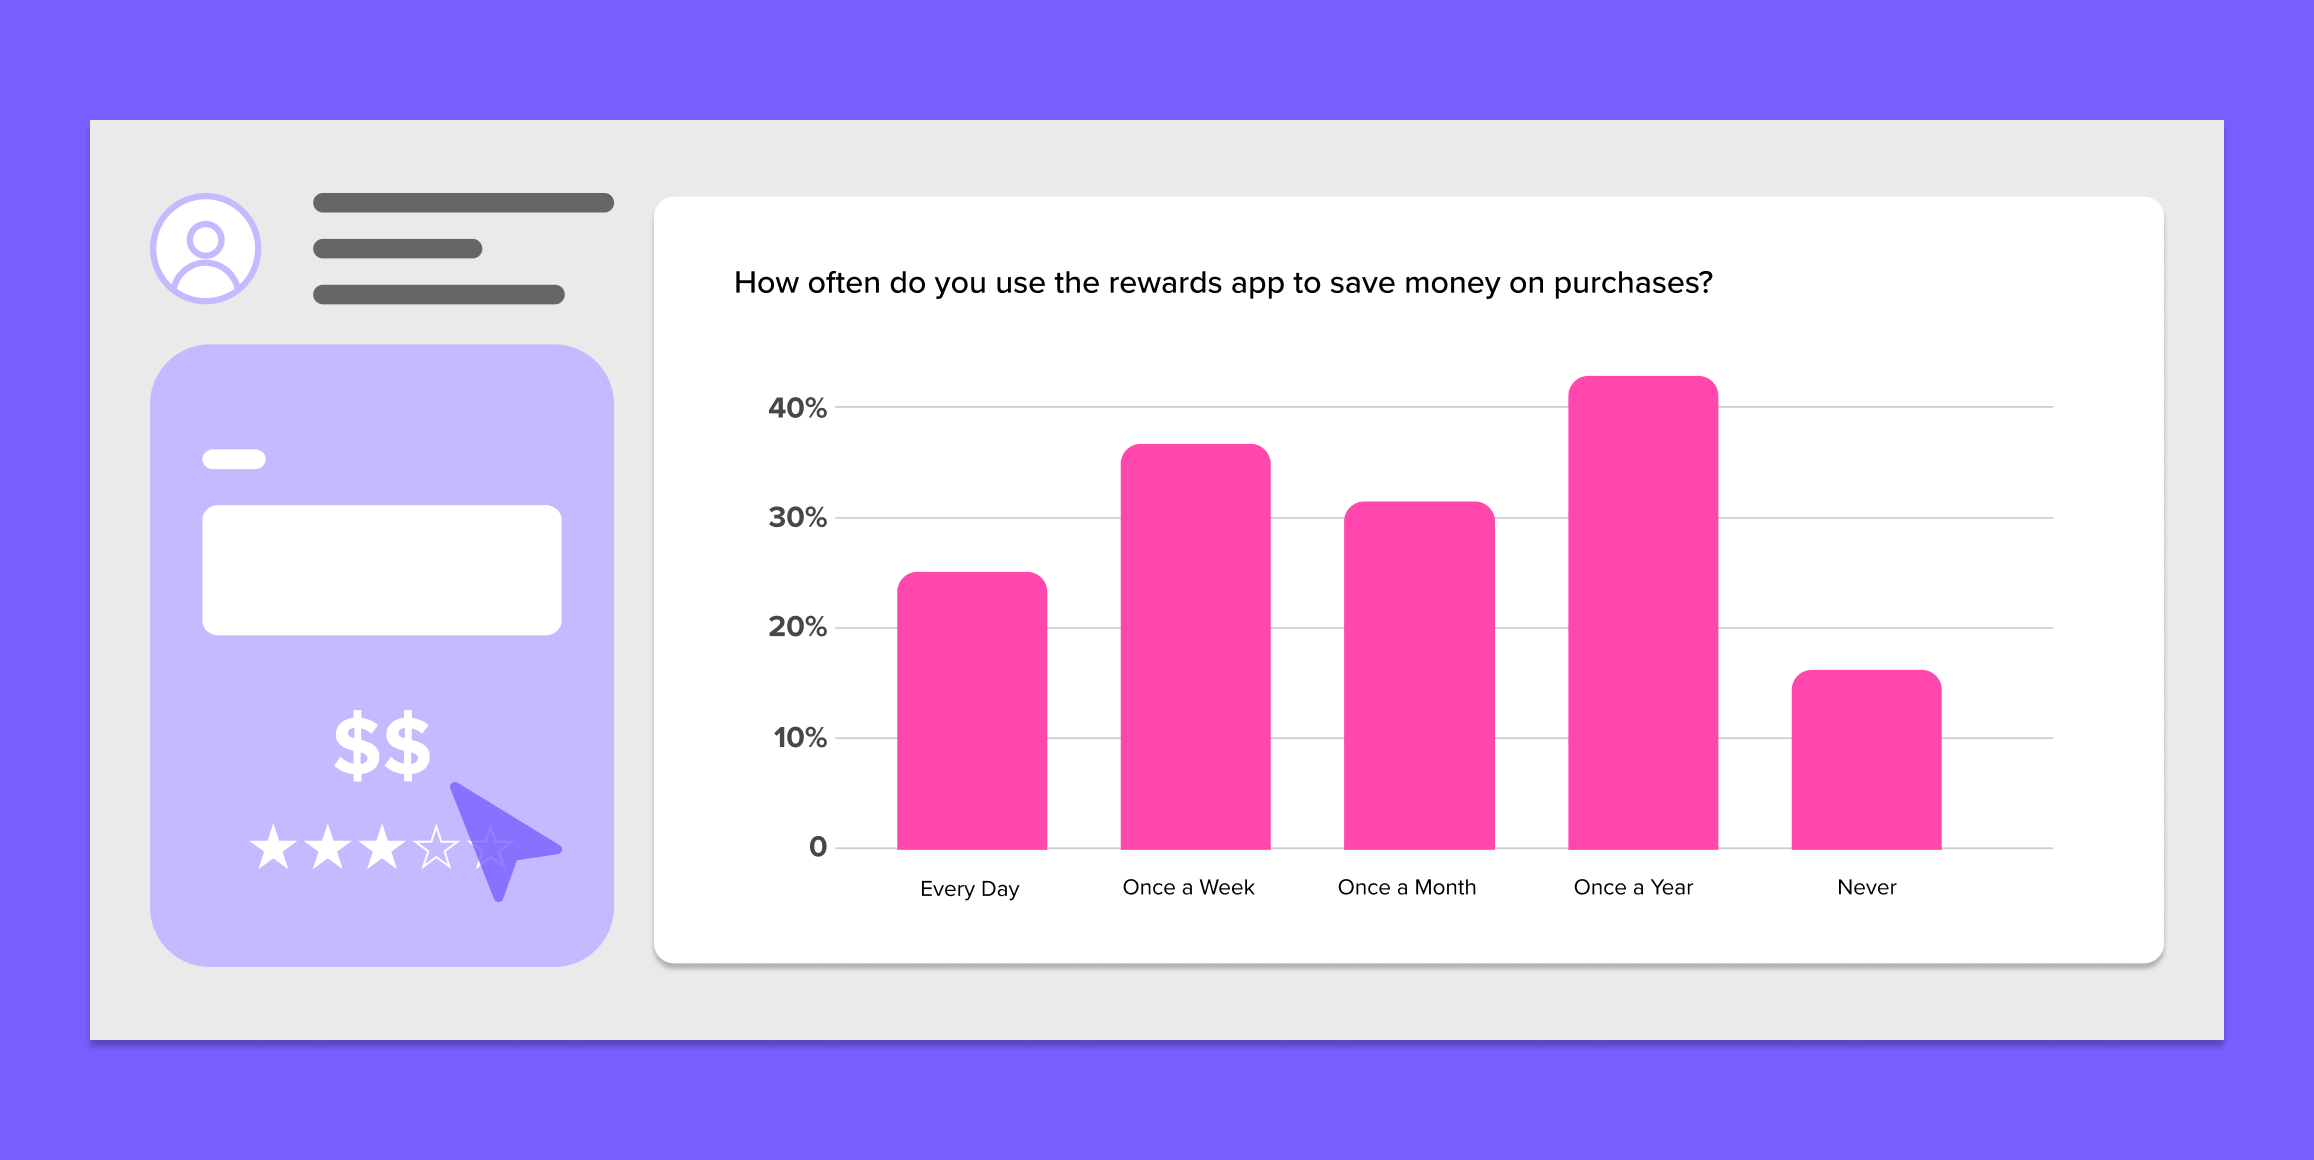
Frequency of Use

Feeling
How to Conduct a Usage and Attitudes Study
Download the Template
Ensure you have the template ready in Figma to streamline your study process. This template is designed to help you effectively gather and analyze data on user behaviors and attitudes.

Define Your Research Objectives and Methods
Determine what specific insights you want to gain about your users. This could include understanding how often they use your product, the contexts in which they use it, and their overall satisfaction and perceptions.
Select the most appropriate methods based on these objectives, which may include surveys, interviews, or observational studies. Utilize Helio’s tools for creating and distributing surveys, and for conducting remote interviews.
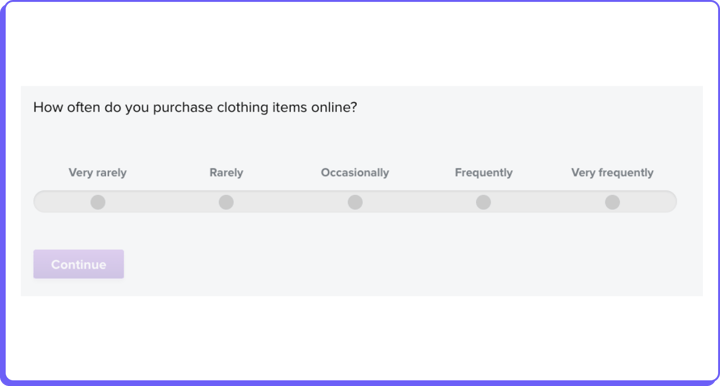
Design and Analyze Your Questionnaire
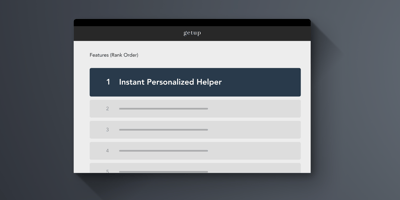
Include a mix of multiple-choice, Likert scale, and open-ended questions to gather comprehensive data. Ensure your questions cover both usage patterns and attitudinal insights. Use behavioral questions to understand user actions and preferences.
Use Helio’s analytics tools to uncover patterns and insights. Visualize the data using graphs and charts to make it easier to interpret. Look for common themes in qualitative responses to identify key user sentiments.
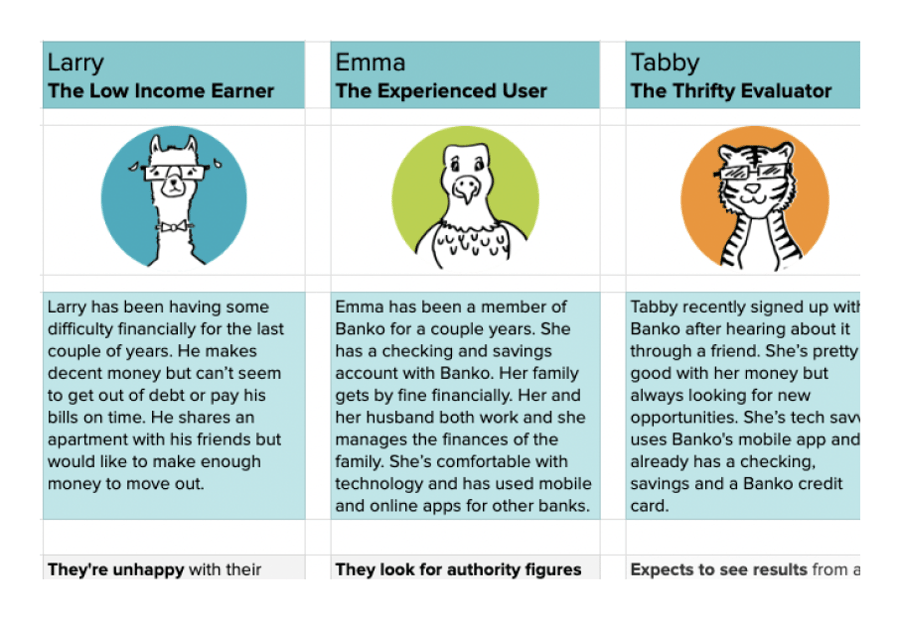
Create User Personas
Profile different user types, highlighting their behaviors, attitudes, and needs. This will help you understand the diverse segments within your user base and tailor your strategies accordingly.
Implement, Monitor, and Measure
Based on the findings, make informed decisions to improve your product offerings, user experience, and marketing messages. Prioritize changes that address the most critical pain points and unmet needs.
Use relevant KPIs to measure the effectiveness of your adjustments. Monitor customer acquisition, retention, and satisfaction rates to ensure your changes lead to positive outcomes.
Working with Helio has allowed us to engage with our customers in a new way. We can receive feedback and connect with our Providers on high-priority initiatives to the business before executing, minimizing risk to the business while at the same time creating community with our customers.

Angeliki King, Hydrafacial

Find answers to business questions
These questions guide your landing page testing efforts to optimize user experience, increase conversions, and achieve your business goals.
Usage and Attitude (U&A) studies help us understand why customers choose us. By exploring how they use our products and their opinions, we gain insights into their needs and preferences. This allows us to adjust our offerings to better meet their expectations.
Various factors influence a customer’s decision to buy, such as lifestyle changes or new trends. U&A studies help us stay in tune with these triggers.
For more insights, check out our guide on Consumer Psychology, covering concepts like effort justification that affect purchasing decisions.
U&A studies reveal how various customer segments view our brand and products. By analyzing data, we identify patterns and preferences among different groups.
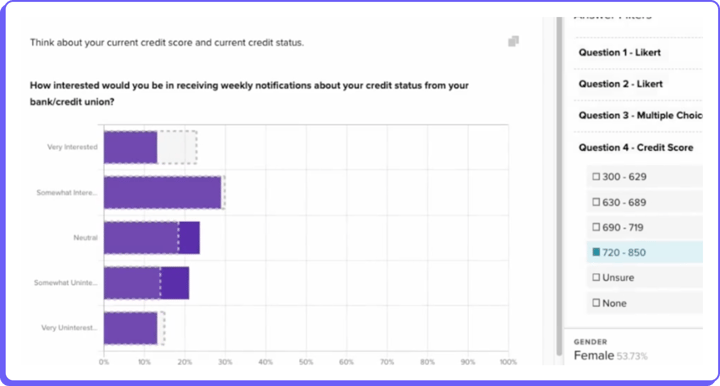
Different segments have unique needs. For instance, some customers might prioritize credit status updates, while others might not. U&A studies help us cater to each segment effectively.
Explore our Global Report Filtering feature to filter responses by demographics and surface real-time audience insights.
U&A studies help us identify where customers face challenges, allowing us to improve their experience. We analyze data to pinpoint areas of struggle and dissatisfaction.
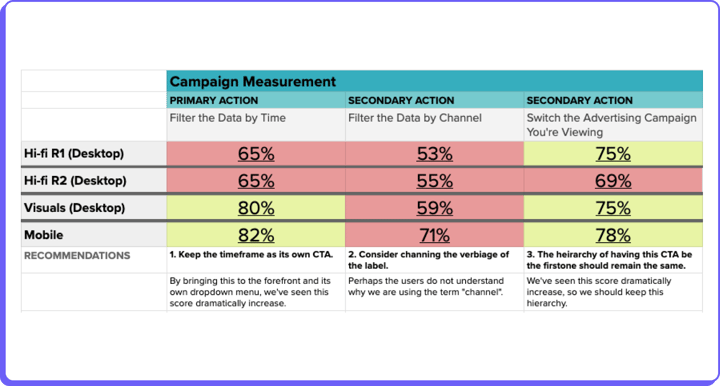
For example, a recent campaign showed high engagement on desktop visuals but lower on channel filters. This insight helps us focus on improving user interaction.
Check out our User Journey Mapping article to uncover user obstacles and enhance their experience.
Analyzing performance metrics across channels helps us see which are most effective for reaching and converting our audience. Channel Performance Analysis shows conversion rates, while Attribution Modeling highlights each channel’s contribution.
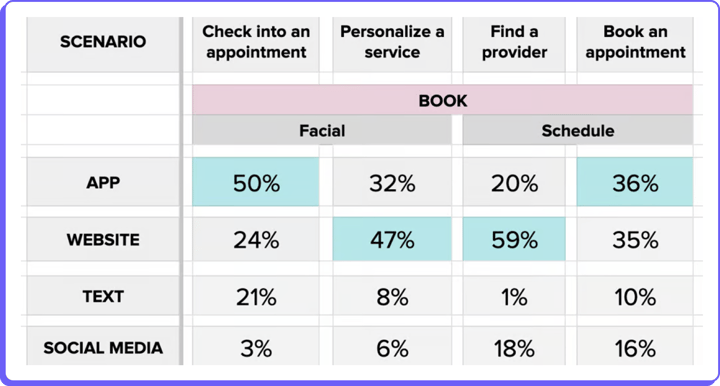
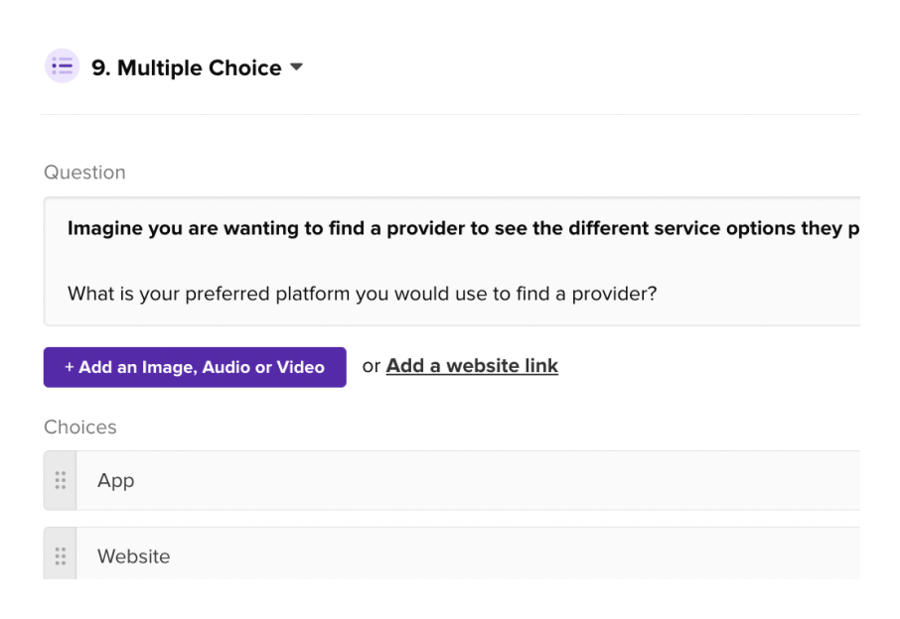
For instance, our Action Map for booking facials shows the app is most effective for check-ins, while the website excels in personalizing services.
By understanding these insights, we can allocate resources efficiently and tailor marketing strategies to leverage each channel’s strengths, maximizing conversions.
Test Template Example

Validate Audience Test Template
Test outcomes:
- Assist in the maintenance of other consumer profiling methods
- Provide insight into campaign performance
- Ensure your product’s unique selling point aligns with your target audience’s needs
FAQs
Helio’s tools provide real-time data and behavioral analysis to identify patterns in customer interactions and purchasing behavior. By understanding these habits, you can tailor your products and marketing strategies to meet customer needs better. This leads to increased customer satisfaction and higher conversion rates.
Helio uses various methods such as surveys, interviews, ethnographic studies, and data analytics to gather comprehensive insights into buyer behavior. These methods help capture qualitative and quantitative data, providing a well-rounded understanding of customer motivations. This data is crucial for making informed product development and marketing decisions.
Understanding buyer behavior allows you to design products that align closely with customer needs and preferences. By prioritizing features that matter most to your users, you can enhance product functionality and user experience. This customer-centric approach leads to higher satisfaction and loyalty.
Helio’s insights help you stay ahead of market trends by understanding shifting buyer attitudes. With detailed user data, you can differentiate your product offerings and create targeted marketing campaigns. This strategic advantage helps attract and retain more customers in a competitive market.
Key performance indicators include Customer Acquisition Cost (CAC), Customer Lifetime Value (CLV), conversion rate, engagement metrics, and retention rate. These metrics help track the success of your marketing and product strategies. Monitoring these KPIs ensures that your efforts are cost-effective and aligned with business goals.
Collecting and analyzing customer feedback helps identify areas for improvement in your product or service. Use surveys and direct feedback to understand customer pain points and desired features. Implementing these insights into your product development process ensures continuous improvement and increased customer satisfaction.
Market trend analysis helps you understand your target audience’s evolving preferences and behaviors. You can adapt your strategies to meet changing customer needs by staying informed about these trends. This proactive approach allows you to make data-driven decisions that enhance your product’s market relevance and competitiveness.