
Unlock User Behavior Insights with Advanced Heatmap Analysis
![]() Helio Editorial Team . 5 min read
Helio Editorial Team . 5 min read
The Ultimate Guide to Heatmap Analysis. Heatmap analysis is a powerful tool that can provide valuable insights into user behavior on your website. By visually representing data using colors and patterns, heatmaps can help you understand how visitors interact with your site, what areas they focus on, and where they may encounter obstacles or confusion. In this comprehensive guide, we will explore the different aspects of heatmap analysis, including its definition, types, reading techniques, implementation for website optimization, and the top tools available for conducting heatmap analysis.
🔩 The Nuts and Bolts:
- Heatmap Analysis Reveals User Behavior: Heatmap analysis visualizes user interactions using colors, highlighting areas of high engagement and potential confusion. This method simplifies complex data, making it easier to identify patterns and optimize website performance.
- Different Types of Heatmaps Offer Unique Insights: Click, scroll, and move heatmaps each provide distinct information about user behavior, from where they click to how far they scroll. These insights help tailor website design to improve user experience and conversion rates.
- Reading Heatmaps Requires Understanding Colors and Patterns: Intense colors like red indicate high activity, while cooler colors like blue show less engagement. Recognizing these patterns helps identify hotspots and areas needing improvement.
- Heatmaps Enhance User Experience and Navigation: By analyzing heatmap data, businesses can optimize content placement, streamline navigation, and address user pain points, resulting in a smoother and more intuitive browsing experience.
- Top Heatmap Tools Offer Comprehensive Analysis: Tools like those offering click, scroll, and move heatmaps, along with advanced features like session recordings, provide valuable insights into user interactions. These tools enable data-driven decisions for website optimization.
- Choosing the Right Heatmap Tool Depends on Needs and Budget: Different tools offer various features, from click analysis to scroll behavior. Evaluating these tools based on your specific requirements and budget ensures effective heatmap analysis for your website.
- Implementing Heatmap Analysis Drives Conversions: By leveraging heatmap insights, businesses can make data-driven decisions that enhance user engagement and conversion rates. Understanding user behavior leads to more effective website optimization strategies.
Understanding Heatmap Analysis
Definition and Importance of Heatmap Analysis
Heatmap analysis is a method of visualizing data using a color-coded grid. It allows you to see which areas of a webpage attract the most attention and which ones are ignored. This information is crucial for understanding user behavior, improving website design, and optimizing conversion rates.
Heatmaps provide an intuitive way to interpret complex data by highlighting patterns and trends, especially when analyzing UX metrics. They eliminate the need to sift through raw numbers and statistics, making it easier to identify areas of improvement in the user experience and make data-driven decisions.
Understanding heatmap analysis goes beyond just visualizing data; it delves into the psychology of user interaction with a website. By analyzing heatmap data, businesses can gain insights into user preferences, behavior, and pain points, ultimately leading to a more user-centric design approach.
Key Components of a Heatmap
A heatmap comprises several key components that help in analyzing user behavior effectively. These components include:
Colors: A heatmap uses a range of colors to represent different levels of user engagement. Brighter colors, such as red and orange, indicate high activity, while cooler colors like blue and green represent lower activity.
Intuitive Scale: Heatmaps use a scale to show the intensity or frequency of user interactions. This scale helps in understanding the significance of different heatmap colors and patterns.
Hotspots: These are the areas on a webpage where users concentrate their attention the most. Hotspots are usually indicated by intense colors and are key areas to focus on for optimization.
Moreover, heatmaps can also reveal scroll depth, indicating how far users are willing to scroll down a page before losing interest. This information is valuable for optimizing content placement and ensuring that important information is visible without excessive scrolling.
Make your design decisions count.
Subscribe to Design Under Pressure. Get insights, UX metrics, and tools for bold, informed design.
We respect your inbox. Just insights. No fluff. Privacy Policy.
Different Types of Heatmaps
Heatmaps are powerful tools that provide valuable insights into user behavior on websites. By visualizing data in a graphical format, heatmaps help website owners understand how users interact with their content. In addition to click, scroll, and move heatmaps, there are other types of heatmaps that can offer unique perspectives on user engagement.
Click Heatmaps
Click heatmaps display the areas where users click on a webpage. By analyzing click data, you can determine which elements attract the most attention and optimize them for improved user experience and conversion rates. Click heatmaps provide essential insights into the effectiveness of call-to-action buttons, navigation menus, and other interactive elements on your site.
Scroll Heatmaps
Scroll heatmaps track how far users scroll down a webpage. By visualizing scrolling behavior, you can identify whether users are reaching important content placed lower on the page. This information is invaluable for optimizing content placement and improving engagement on pages with long-form content.
Move Heatmaps
Move heatmaps track cursor movement and help you understand how users navigate through your website. By identifying the paths users take and the elements that attract their attention, you can optimize the layout and design of your pages to guide users towards desired actions.
Hover Heatmaps
Hover heatmaps track where users move their mouse cursor without clicking. This type of heatmap can reveal areas of interest or confusion on a webpage, showing where users are exploring or hesitating. By analyzing hover data, website owners can make informed decisions about design changes or content placement to enhance user engagement.
How to Read a Heatmap
Interpreting Colors and Patterns
When reading a heatmap, it is essential to understand the significance of colors and patterns. Intense colors like red and orange indicate high user activity, while cooler colors like blue and green represent lower activity. Areas with brighter colors are the hotspots that require attention for optimization.
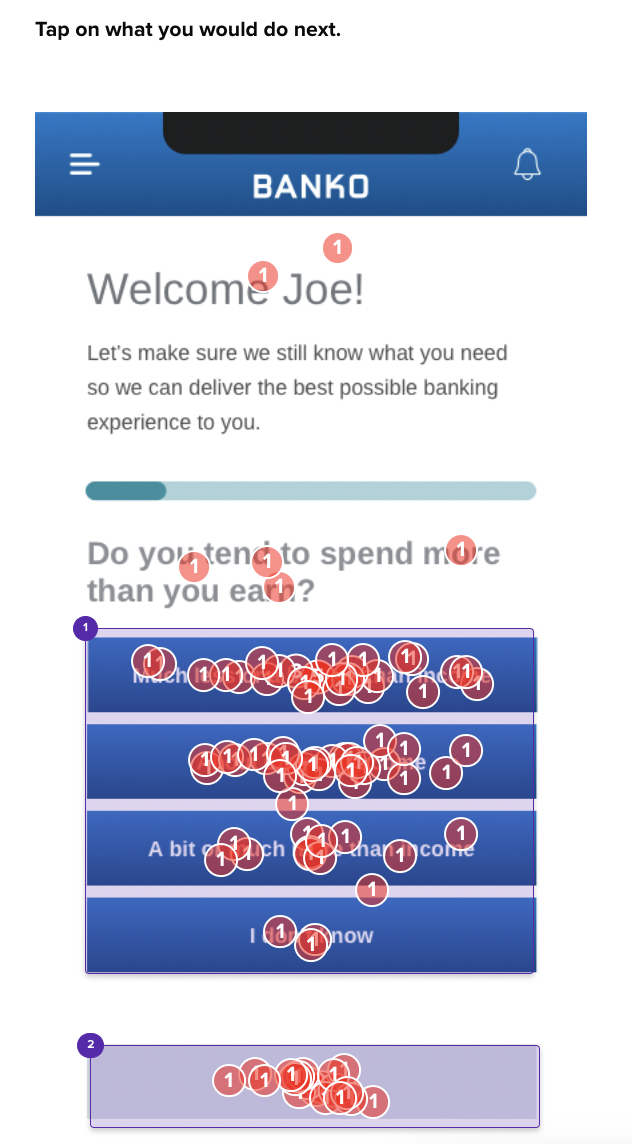
Patterns within a heatmap can provide insights into user behavior. For example, dense clusters of clicks or scrolls in certain areas may indicate high user interest, while scattered patterns may suggest confusion or lack of engagement.
Moreover, the size of the colored areas in a heatmap can also convey important information. Larger areas of intense color signify a higher volume of interactions, indicating popular sections of a webpage that attract significant user attention. On the other hand, small pockets of color may reveal specific elements that are either overlooked or underutilized.
UX Metric
Recognizing User Behavior Through Heatmaps
Heatmaps can reveal valuable information about user behavior. For instance, click heatmaps can show whether users are clicking on non-clickable elements, indicating confusion or frustration.
Scroll heatmaps can help identify the point at which users lose interest and exit the page. Move heatmaps can highlight areas where users spend the most time, giving insights into content effectiveness and potential conversion points.
Furthermore, overlay heatmaps provide a comprehensive view of user interactions by combining click, move, and scroll data. This integrated approach can offer a holistic understanding of how users engage with a webpage, pinpointing areas of interest, friction, and opportunities for optimization.
Implementing Heatmap Analysis for Website Optimization
Enhancing User Experience with Heatmaps
Heatmap analysis can significantly improve user experience on your website. By identifying areas of high engagement, you can optimize content placement and ensure that important information is easily accessible. Heatmaps also help uncover elements that are distracting or confusing for users, allowing you to make necessary adjustments for a smoother browsing experience.
Moreover, heatmaps can provide valuable insights into user behavior beyond just clicks and scrolls. They can reveal how far down the page users are willing to scroll, where they tend to linger the most, and even how their mouse movements indicate interest or confusion. By understanding these nuances, you can tailor your website’s design and content to better cater to your audience’s preferences and expectations.
Improving Website Navigation Using Heatmaps
Heatmaps provide insights into how users navigate through your website. By analyzing click and scroll heatmaps, you can optimize your navigation menus, internal links, and call-to-action buttons to guide users to the intended pages and increase your conversion rates. Heatmaps also reveal potential roadblocks in navigation, allowing you to simplify and streamline the user journey.
Furthermore, heatmaps can help you uncover hidden patterns in user behavior, such as recurring navigation paths or unexpected drop-off points. Armed with this information, you can restructure your website’s layout to enhance user flow and encourage exploration of key pages. By continuously monitoring and analyzing heatmap data, you can make data-driven decisions to refine and enhance the overall user experience on your website.
🚀 If you’re using Helio
Leverage a clickmap as a strong alternative to a heatmap on your website or app.
Leverage a visual representation of user behavior, allowing you to understand how visitors interact with your website.
Heatmap Analysis Tools
Top Heatmap Analysis Tools for Your Website
There are numerous heatmap analysis tools available to help you gain valuable insights into your website’s performance. These tools provide a visual representation of user behavior, allowing you to understand how visitors interact with your website. By analyzing heatmaps, you can identify areas of high engagement, optimize your website’s layout, and improve overall user experience.
Let’s take a closer look at some of the top heatmap analysis tools:
Tool 1:
This tool offers comprehensive heatmap analysis, including click, scroll, and move heatmaps. With click heatmaps, you can see where users are clicking the most on your website, helping you identify popular elements and optimize their placement. Scroll heatmaps, on the other hand, provide insights into how far users scroll down your pages, allowing you to optimize content placement and ensure important information is seen. Additionally, this tool provides advanced features such as session recordings and A/B testing, enabling you to delve deeper into user behavior and make data-driven decisions.
Tool 2:
If you’re specifically interested in click analysis, this tool specializes in click heatmaps. It offers detailed click data analysis and click tracking, allowing you to understand which elements on your website attract the most attention. Furthermore, this tool provides segmentation options, enabling you to analyze user behavior based on various criteria such as demographics or traffic sources. This segmentation feature can provide valuable insights into different user groups and help you tailor your website to their specific needs.
Tool 3:
For those looking to optimize user scrolling behavior, this tool focuses on scroll heatmaps. By tracking and analyzing user scrolling patterns, you can gain insights into content engagement. This information can be used to optimize the placement of important information, ensuring that it is seen by a larger portion of your audience. Understanding how users interact with your content as they scroll can also help you identify potential areas for improvement and enhance the overall user experience.
Choosing the Right Heatmap Tool for Your Needs
When selecting a heatmap analysis tool, it’s important to consider your specific requirements and budget. Different tools offer varying features and pricing plans, so it’s crucial to evaluate them based on your needs. Here are some factors to consider:
Heatmap Types: Determine which types of heatmaps are most relevant to your website and choose a tool that offers those specific heatmap options.
Data Visualization: Look for tools that provide clear and intuitive data visualization, allowing you to easily interpret and analyze the heatmap data.
Integration Capabilities: Consider whether the heatmap tool can integrate with other tools you use, such as analytics platforms or A/B testing tools. Integration can streamline your workflow and provide a more comprehensive understanding of your website’s performance.
Pricing Plans: Compare the pricing plans of different heatmap analysis tools and choose one that fits within your budget. Some tools offer free plans with limited features, while others provide more advanced features at a higher cost.
Additionally, reading reviews and seeking recommendations from other website owners or professionals in your industry can provide valuable insights into the effectiveness and usability of different heatmap analysis tools.
With the information provided in this ultimate guide, you now have a solid foundation for incorporating heatmap analysis into your website optimization strategy. By leveraging the power of heatmaps and understanding user behavior, you can make data-driven decisions that drive conversions and create an exceptional user experience on your website. Start exploring the various heatmap analysis tools available and unlock the potential to enhance your website’s performance today!
Heatmap FAQs
Heatmap analysis is a method of visualizing user interactions on a website using a color-coded grid. It highlights areas of high and low engagement, helping businesses understand user behavior and optimize their site accordingly.
Heatmap analysis provides valuable insights into user behavior, such as where visitors click, scroll, and hover. This information helps identify areas for improvement, optimize content placement, and enhance the overall user experience, leading to higher conversion rates.
There are several types of heatmaps, including click heatmaps (showing where users click), scroll heatmaps (indicating how far users scroll), move heatmaps (tracking cursor movement), and hover heatmaps (showing where users move their mouse without clicking). Each type offers unique insights into user behavior.
To read a heatmap, understand the significance of colors and patterns. Intense colors like red and orange indicate high user activity, while cooler colors like blue and green represent lower activity. Recognize hotspots and patterns to identify areas of high engagement and potential issues.
There are several top heatmap analysis tools available, including those offering click, scroll, and move heatmaps. Some popular options also provide advanced features like session recordings and A/B testing. Choosing the right tool depends on your specific needs and budget.
Heatmap analysis helps identify areas of high engagement and user pain points. By optimizing content placement, simplifying navigation, and addressing user issues, businesses can create a smoother and more intuitive browsing experience, ultimately enhancing user satisfaction and conversion rates.
Consider factors such as the types of heatmaps offered, data visualization capabilities, integration with other tools, and pricing plans. Evaluating these aspects based on your specific requirements ensures you choose a tool that effectively supports your heatmap analysis needs.