Overview
Global report filtering allows you to quickly compare responses across target customer groups and surface signals about unique segments of your users. Get feedback from your ideal target audience, and use Helio’s filtering feature to segment the data and find patterns in different customer groups.

You can filter your survey data based on participant demographics, and answers they provide throughout a survey. Learn what type of products your customers use in question 1, and use the filters to compare how those different groups answered question 2. You can activate filters on questions throughout the survey, allowing you to trace back later participant answers to earlier decisions.
Report filtering is great for building personas, understanding user motivations, and discovering unique customer groups. We’ll show you an example of using GRF on a banking behaviors test to break it all down!
Use Case
One way to use report filtering is to understand how sub-groups in an audience react differently to certain ideas. For instance, banking and financial habits is important information for many businesses to learn about their customers. With such a vast audience of banking consumers, it’s important to identify how different segments of those consumers react compared to others.
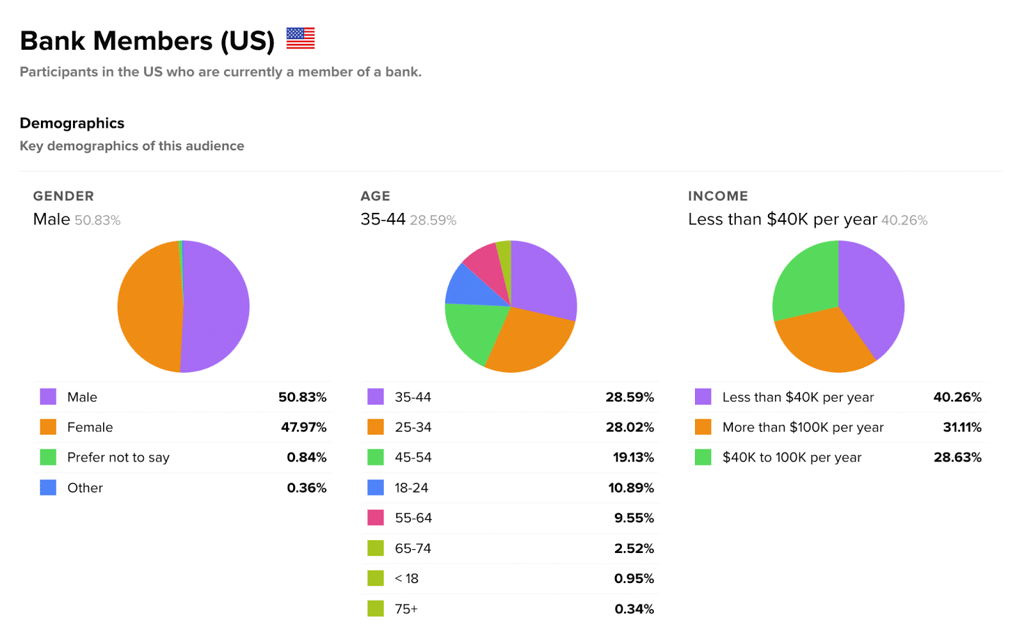
A company called Banko ran a test with an audience of Banking Consumers in the US to understand their financial habits and how that maps to their credit scores.

A new feature idea at Banko proposes new notification options for users based on their current credit scores. Users would have the option to be updated on their credit status on a weekly, even daily, basis. Banko believes that consumers with lower credit scores are more likely to keep a close eye on their credit and would appreciate this feature.

To understand whether banking consumers would be interested in this feature, Banko asked participants what their current banking behaviors are, and then followed up with questions about their current financial situation.

Once the data has been collected, the Global Report Filters let Banko compare different subsets of this audience and understand how financial situations influence banking behaviors.
First, they focused on the group of participants who indicated they have lower credit scores below 690.
Banko activated their filters on the lower credit score participants so they could trace this group of participants throughout the survey and compare their answers to the wider group.

When looking at how this subset of participants currently operates, our Global Report Filtering feature revealed the difference between the lower credit score group and the original data set.

This data showed Banko that their low credit score consumers are likely to check their credit score on a more frequent basis. 12% of consumers with higher credit scores would check their score on a weekly basis, while up to 35% participants with scores under 689 would be constantly checking their credit. This confirms that a significant group of Banko’s consumers, up to 35%, would be interested in seeing their credit score on a more regular basis.
With this validation, the Banko team can confidently go to their stakeholders and recommend different approaches for their users based on their credit scores.
How It Works
The Global Report Filtering feature now allows you to select any answer option in a survey and filter the results down to that specific sub-set of participants.

Previously, Helio’s data report allowed for filtering responses by demographics such as income, age, and education. We’re still maintaining that feature of course!

Now, you can select any answer choice in your survey to use as a data filter. This means that you can select all the participants who chose answer B in question 1, and see what they said to question 5 in your survey. Then, change your filters and select people who chose answer A in question 1, and compare those group’s responses.

When you activate a filter on a question, you’ll also get to see our “ghost bars” (???? name under construction ????) which show you the comparison of the original data set to your new filtered data.

You may also notice that this update has come with a fancy new outfit for our data report page. The new Audience bar will appear at the top of the data report to show your audience summary, active filters, and response percentages.

If you’ve somehow gotten tired of clicking filters on & off in your data charts (we haven’t), you can control everything from the new Filters tab in each data report. This gives you quick access to turn on/off all of the filters available throughout your survey.

We’ll use this new filtering feature to compare responses across audiences, analyze participants’ reactions across different channels in a survey, and create user personas based on response comparisons.
We’re excited to hear how you put our new global report filtering to the test. Please reach out to our team if you have any questions about your new data report features!


